
Figures & data
Table 1 Patient Characteristics of T2 Low and Non-T2 Low Severe Uncontrolled Asthma Patients at Baseline
Figure 1 Healthcare resource utilisation related all-cause and respiratory related costs per patient-year (PPY, mean and 95% CI) during follow-up.
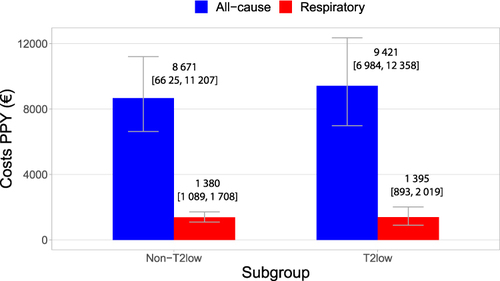
Figure 2 Healthcare resource utilisation related all-cause (blue) and respiratory (red) costs per patient-year (PPY, mean and 95% CI) during follow-up in non-T2 low (left) and T2 low patients (right). Costs stratified into emergency room (ER), hospitalizations, and outpatient visit related costs.
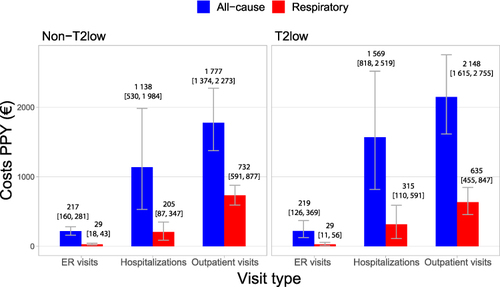
Figure 3 Medication costs per patient-year (PPY, mean and 95% CI) per ATC classes of interest during follow-up in severe uncontrolled T2 low (red) vs non-T2 low patients (blue). A10* (diabetes), C* (cardiovascular system), H02* (systemically used corticosteroids), J* (anti-infectives for systemic use), M05* (drugs for treatment of bone diseases, N06A* (antidepressants), R* (respiratory system, including medication for upper and lower airways).
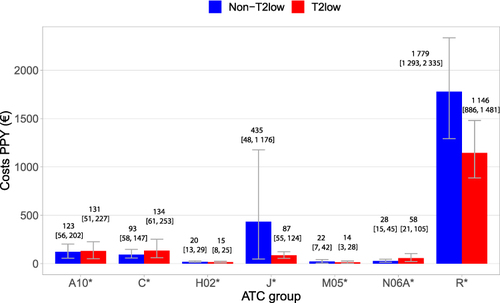
Figure 4 Mean cumulative function (mean and 95% CI) of all-cause healthcare costs during follow-up in severe uncontrolled T2 low vs non-T2 low patients.
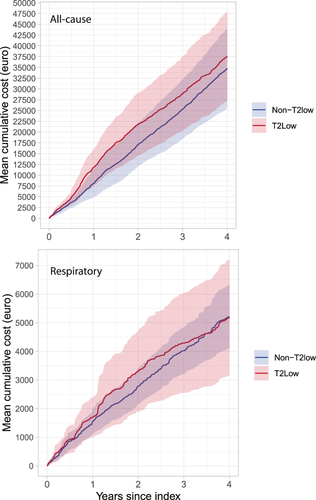
Table 2 Regression Model of the Association of Patient Characteristics and T2 Status on Healthcare Resource Utilisation
Data Sharing Statement
All data and study materials are kept in an audited square analysis environment of Findata the central permission authority, access to data is only for those named in the permission. Data underlying the findings described in this manuscript may be obtained in accordance with AstraZeneca’s data sharing policy described at: https://astrazenecagrouptrials.pharmacm.com/ST/Submission/Disclosure.