
Figures & data
Table 1 Sociodemographic and Clinical Characteristics of the Patients
Table 2 The Level of Psychological Disorders According to the Level of Asthma Control
Figure 1 (A) Bar chart representing the patients’ distribution in the three categories of educational level in relation to their level of asthma control. (B) Bar chart representing the patients’ distribution in the four categories of psychological conditions in relation to their level of asthma control.
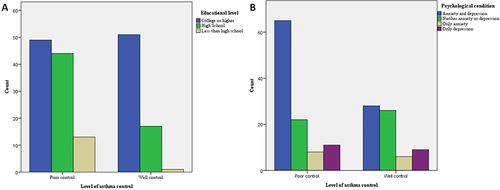
Table 3 Analysis of Patients’ Sociodemographic and Clinical Features According to the Level of Asthma Control
Figure 2 Significant correlations between the ACT scores and HADS scores.
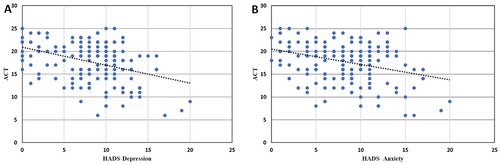
Table 4 Multivariate Logistic Regression Model Risk Factors of Poorly Controlled Asthma (ACT < 20)
Table 5 Features of the Involved Patients According to Their Psychological Conditions
Data Sharing Statement
The data utilized and analyzed during the current study are available from the corresponding author upon request.