
Figures & data

Table 1 Demographic Data of Study Participants
Table 2 The List of Proteins Upregulated in Nasal Lavage Fluid Between AR, Asthma, and Asthma +AR as Compared with HCs
Figure 1 Differentially expressed proteins (DEPs) among AR, asthma, combined asthma+ AR and healthy controls (HCs) for nasal lavage fluid. Volcano plot of DEPs, (A) AR vs HCs; (B) asthma vs HCs; (C) combined asthma+ AR vs HCs; (D) Venn diagram of DEPs. Fold change ≥2.0 or fold change ≤0.5 (false-discovery rate, FDR <0.05). AR, allergic rhinitis, HCs, healthy controls.
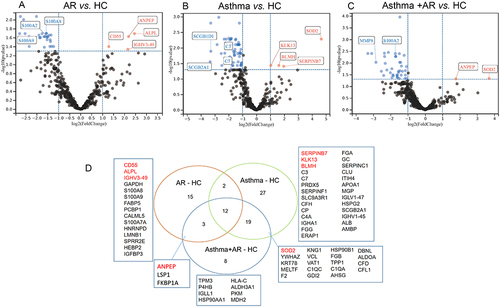
Figure 2 DEPs among AR, asthma, combined asthma +AR, and HCs (A) CD55, (B) C3, (C) C5, (D) C7, (E) ANPEP, (F) ALPL, (G) SOD2, (H) SERPINB7, (I) KLK13 AR, allergic rhinitis, HCs, healthy controls, DEPs, differentially expressed proteins. *P < 0.05, **P < 0.01, ***P < 0.001.
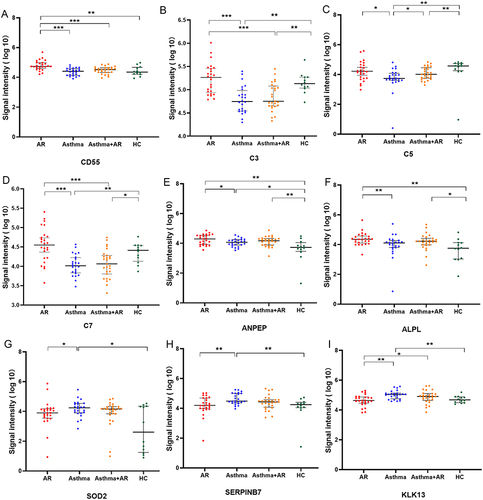
Figure 3 Proteomic analysis in patients with asthma according to asthma control. (A) Volcano plot of DEPs, Fold change ≥1.5 or ≤0.66 (P < 0.05), (B) Pearson correlation heat maps of DEPs, (C) STRING protein–protein interaction (PIP) network based on DEPs (P < 0.05), (D) the abundance of DEPs. DEPs, differentially expressed proteins. *P < 0.05, **P < 0.01.
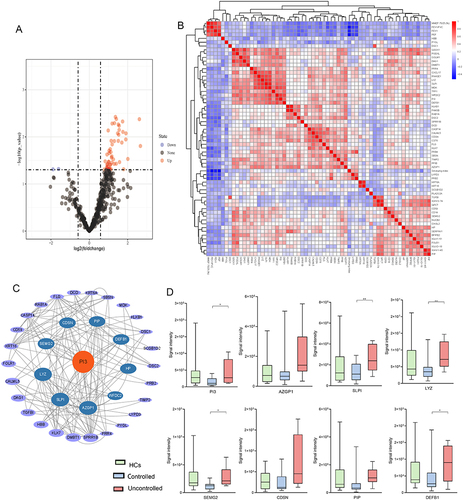
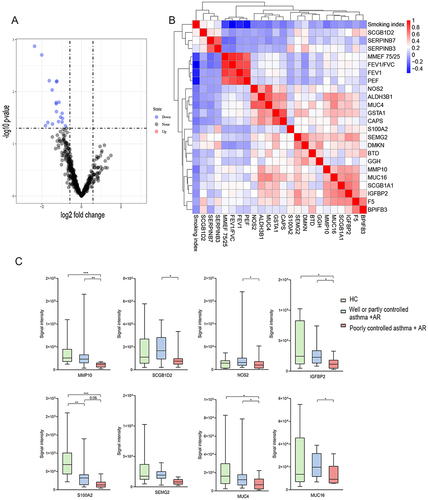
Figure 4 Proteomic analysis in patients with combined asthma +AR according to asthma control. (A) Volcano plot of DEPs. Fold change ≥1.5 or ≤0.66 (P < 0.05), (B) Pearson correlation heat maps of DEPs, (C) the abundance of DEPs. DEPs, differentially expressed proteins. *P < 0.05, **P < 0.01, *** P < 0.001.
Data Sharing Statement
The data that support the findings of this study are available from the corresponding author upon reasonable request.