Figures & data
Figure 1 t-test P-values of impulse oscillometry parameters (frequency-dependent resistance [R5–R20], * and reactance [AX], ■) at each time point after administration of Advair or Symbicort during randomization visits compared to the patients’ baseline R5–R20 and AX values (0.204 cmH2O/L/second and 1.526 cmH2O/L, respectively, for Advair; 0.259 cmH2O/L/second, and 2.332 cmH2O/L, respectively, for Symbicort) during the same visit (n = 15 for each group).
![Figure 1 t-test P-values of impulse oscillometry parameters (frequency-dependent resistance [R5–R20], * and reactance [AX], ■) at each time point after administration of Advair or Symbicort during randomization visits compared to the patients’ baseline R5–R20 and AX values (0.204 cmH2O/L/second and 1.526 cmH2O/L, respectively, for Advair; 0.259 cmH2O/L/second, and 2.332 cmH2O/L, respectively, for Symbicort) during the same visit (n = 15 for each group).](/cms/asset/6ea58cc1-5959-4626-b4e2-c3f855159b21/djaa_a_48827_f0001_c.jpg)
Figure 2 t-test P-values of impulse oscillometry parameters (frequency-dependent resistance [R5–R20], * and reactance [AX], ■) at each time point after administration of Advair or Symbicort during final visits compared to the patients’ baseline R5–R20 and AX values (0.164 cmH2O/L/second and 1.171 cmH2O/L, respectively, for Advair; 0.127 cmH2O/L/second and 0.833 cmH2O/L, respectively, for Symbicort) during the same visit (n = 15 for each group).
![Figure 2 t-test P-values of impulse oscillometry parameters (frequency-dependent resistance [R5–R20], * and reactance [AX], ■) at each time point after administration of Advair or Symbicort during final visits compared to the patients’ baseline R5–R20 and AX values (0.164 cmH2O/L/second and 1.171 cmH2O/L, respectively, for Advair; 0.127 cmH2O/L/second and 0.833 cmH2O/L, respectively, for Symbicort) during the same visit (n = 15 for each group).](/cms/asset/bd747d6d-8446-49e4-b5c0-184cce055ad0/djaa_a_48827_f0002_c.jpg)
Figure 3 t-test P-values of model estimates (peripheral airway resistance [Rp], ■; peripheral airway compliance [Cp], ×) at each time point after administration of Advair or Symbicort during randomization visits compared to the patients’ baseline Rp and Cp values (0.547 cmH2O/L/second and 0.084 L/cmH2O, respectively, for Advair; 0.689 cmH2O/L/second and 0.067 L/cmH2O, respectively, for Symbicort) during the same visit (n = 15 for each group).
![Figure 3 t-test P-values of model estimates (peripheral airway resistance [Rp], ■; peripheral airway compliance [Cp], ×) at each time point after administration of Advair or Symbicort during randomization visits compared to the patients’ baseline Rp and Cp values (0.547 cmH2O/L/second and 0.084 L/cmH2O, respectively, for Advair; 0.689 cmH2O/L/second and 0.067 L/cmH2O, respectively, for Symbicort) during the same visit (n = 15 for each group).](/cms/asset/dc0c5baa-1522-4370-9d52-d5b9925fcf73/djaa_a_48827_f0003_c.jpg)
Figure 4 t-test P-values of model estimates (peripheral airway resistance [Rp], ■; peripheral airway compliance [Cp], ×) at each time point after administration of Advair or Symbicort during final visits compared to the patients’ baseline Rp and Cp values (0.472 cmH2O/L/second and 0.115 L/cmH2O, respectively, for Advair; 0.426 cmH2O/L/second and 0.136 L/cmH2O, respectively, for Symbicort) during the same visit (n = 15 for each group).
![Figure 4 t-test P-values of model estimates (peripheral airway resistance [Rp], ■; peripheral airway compliance [Cp], ×) at each time point after administration of Advair or Symbicort during final visits compared to the patients’ baseline Rp and Cp values (0.472 cmH2O/L/second and 0.115 L/cmH2O, respectively, for Advair; 0.426 cmH2O/L/second and 0.136 L/cmH2O, respectively, for Symbicort) during the same visit (n = 15 for each group).](/cms/asset/348de1c4-834a-4e3c-ab79-21fcf2199203/djaa_a_48827_f0004_c.jpg)
Table 1 Mean values of impulse oscillometry system frequency-dependent resistance (R5–R20; cmH2O/L/s) and reactance AX (cmH2O/L), peripheral airway resistance (Rp; cmH2O/L/s), and peripheral airway compliance (Cp; L/cmH2O) at baseline (BL) and each time point after administration of Advair or Symbicort during the randomization and final visits
Figure 5 Box plots of the individual impulse oscillometry frequency-dependent reactance (AX) values at two time points each during the randomization visits (VR) and the final visits (VF) for (A) the Advair group and (B) the Symbicort group.(/p)(p)Abbreviation: BL, baseline.
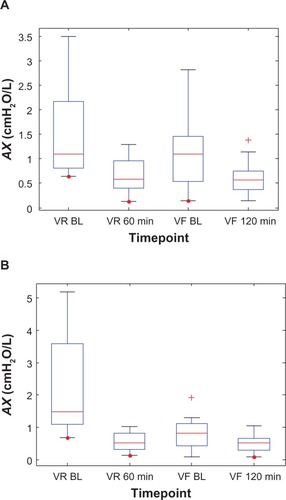
Figure 6 Box plots of the individual impulse oscillometry frequency-dependent resistance (R5–R20) values at two time points each during the randomization visits (VR) and the final visits (VF) for (A) the Advair group and (B) the Symbicort group.(/p)(p)Abbreviation: BL, baseline.
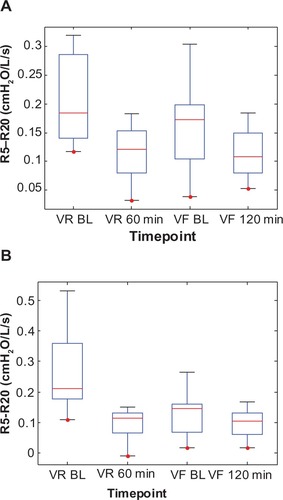
Figure 7 Box plots of the individual peripheral airway compliance (Cp) values at two time points each during the randomization visits (VR) and the final visits (VF) for (A) the Advair group and (B) the Symbicort group.(/p)(p)Abbreviation: BL, baseline.
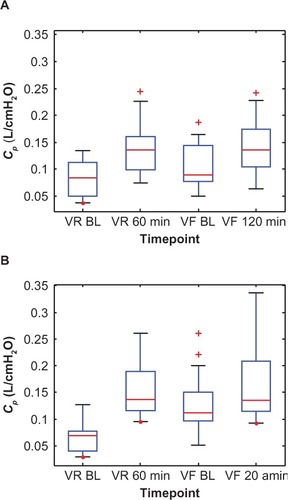
Figure 8 Box plots of the individual peripheral airway resistance (Rp) values at two time points each during the randomization visits (VR) and the final visits (VF) for (A) the Advair group and (B) the Symbicort group.(/p)(p)Abbreviation: BL, baseline.
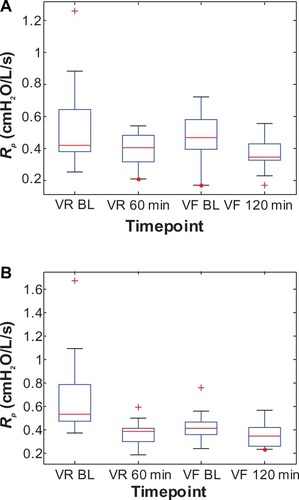
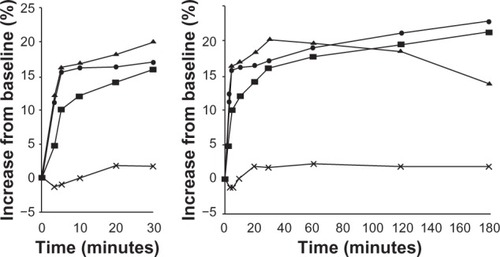
Figure 9 Mean forced expiratory volume in 1 second (FEV1) during the first 180 minutes after inhalation of budesonide/formoterol (pressurized metered-dose inhaler [pMDI] 2 × 160/4.5 mg), salmeterol/fluticasone (pMDI 2 × 25/250 mg), salbutamol (2 × 100 mg), or placebo (percentage increase from predrug value). Copyright © 2001, Elsevier. Palmqvist M, Arvidsson P, Beckman O, Peterson S, Lötvall J. Onset of bronchodilation of budesonide/formoterol vs salmeterol/fluticasone in single inhalers. Pulm Pharmacol Ther. 2001;14(1):29–34.Citation2
![Figure 9 Mean forced expiratory volume in 1 second (FEV1) during the first 180 minutes after inhalation of budesonide/formoterol (pressurized metered-dose inhaler [pMDI] 2 × 160/4.5 mg), salmeterol/fluticasone (pMDI 2 × 25/250 mg), salbutamol (2 × 100 mg), or placebo (percentage increase from predrug value). Copyright © 2001, Elsevier. Palmqvist M, Arvidsson P, Beckman O, Peterson S, Lötvall J. Onset of bronchodilation of budesonide/formoterol vs salmeterol/fluticasone in single inhalers. Pulm Pharmacol Ther. 2001;14(1):29–34.Citation2](/cms/asset/ead1c36f-8c06-4faa-ab26-6a227f6940a0/djaa_a_48827_f0009_b.jpg)
Figure 10 Percent change in forced expiratory volume in 1 second (FEV1) up to 15 minutes and 3 hours with the combination of budesonide/formoterol (one or two inhalations) (160/4.5 mg) compared with the combination salmeterol/fluticasone (50/250 mg) and placebo. Reprinted from Lindberg et al,Citation10 with permission from John Wiley and Sons.