
Figures & data
Table 1 Characterization of asthma patients
Figure 1 Classification of asthma patients according to airway inflammation.
Notes: 191 asthma patients were classified by hierarchical cluster analysis with indicated parameters. (A) Dendrogram. (B) At entry to the high-altitude clinic, FEV1 values, ECP and blood eosinophil levels, and Junipers asthma symptom score were evaluated for cluster 1 and 2. (C) Changes in FEV1, ECP, and blood eosinophils after 3 weeks of asthma therapy from cluster 1 and 2. C1: asthma patients in cluster 1; C2: asthma patients in cluster 2; *P<0.05, ***P<0.001; unpaired t-test was used.
Abbreviations: ECP, eosinophil cationic protein; FEV1, forced expiratory volume in 1 second; n, number of asthma patients.
Abbreviations: ECP, eosinophil cationic protein; FEV1, forced expiratory volume in 1 second; n, number of asthma patients.
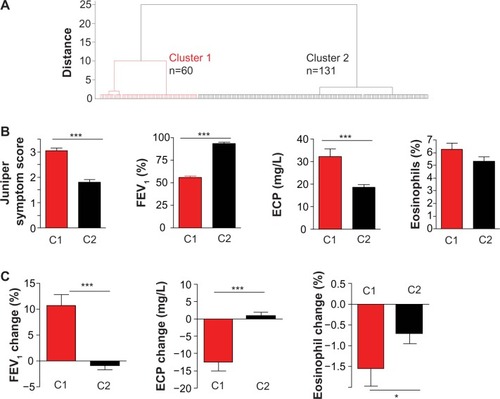
Figure 2 Asthma patients in cluster 1 respond better to asthma therapy.
Notes: (A) FEV1, serum ECP levels, blood eosinophil levels and exhaled NO at the beginning of the high altitude stay (entry) and after 3 weeks (discharge). (B) Fraction of patients with systemic steroids and inhaled steroids, systemic steroid dose and frequency of inhaled short acting β2 agonist usage. The paired t-test was used to compare changes in indicated parameters between entry and discharge. **P<0.01; ***P<0.001.
Abbreviations: ECP, eosinophil cationic protein; FEV1, forced expiratory volume in 1 second; n, number of asthma patients; NO, nitric oxide.
Abbreviations: ECP, eosinophil cationic protein; FEV1, forced expiratory volume in 1 second; n, number of asthma patients; NO, nitric oxide.
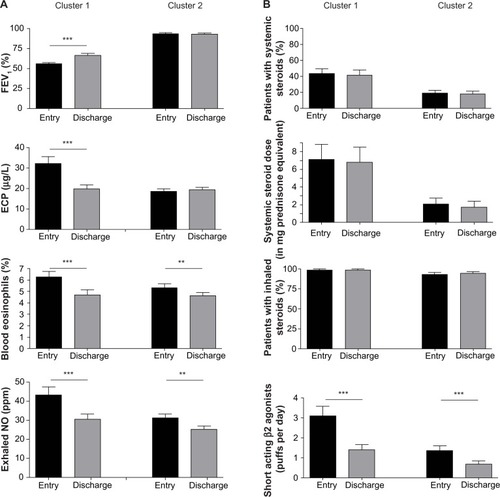
Figure 3 Upregulation of serum cytokines and chemokines in asthma patients belonging to uster 1.
Notes: Serum levels of IL-8, eotaxin, VEGF, CTACK, GROα, and HGF in patients belonging to cluster 1 or to cluster 2 are shown. Mann–Whitney U test was used. *P<0.05.
Abbreviations: CTACK, cutaneous T-cell-attracting chemokine; GRO, growth-related oncogene; HGF, hepatocyte growth factor; IL, interleukin; VEGF, vascular endothelial growth factor.
Abbreviations: CTACK, cutaneous T-cell-attracting chemokine; GRO, growth-related oncogene; HGF, hepatocyte growth factor; IL, interleukin; VEGF, vascular endothelial growth factor.
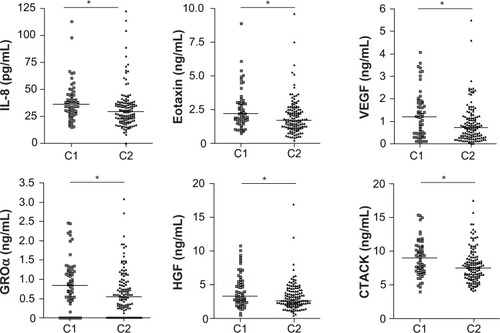
Figure 4 Prognostic value of serum cytokines to distinguish between asthma patients belonging to cluster 1 or 2.
Notes: ROC for the principal component of the serum cytokines IL-8, eotaxin, VEGF, CTACK, GROα, and HGF to distinguish between cluster 1 and 2 was analyzed. (A) Area under the curve produced a sensitivity of 55.9% and a specificity of 75.8% to discriminate between asthma patients from cluster 1 and cluster 2. (B) ROC analyses of the single cytokines. (C) There is a negative correlation between cytokine expression assessed by the principal component analyses of the serum cytokines upregulated in cluster 1 and FEV1 values.
Abbreviations: CTACK, cutaneous T-cell-attracting chemokine; FEV1, forced expiratory volume in 1 second; GRO, growth-related oncogene; HGF, hepatocyte growth factor; IL, interleukin; ROC, receiver operating characteristic; VEGF, vascular endothelial growth factor.
Abbreviations: CTACK, cutaneous T-cell-attracting chemokine; FEV1, forced expiratory volume in 1 second; GRO, growth-related oncogene; HGF, hepatocyte growth factor; IL, interleukin; ROC, receiver operating characteristic; VEGF, vascular endothelial growth factor.
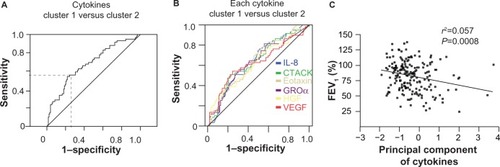
Table S1 Serum cytokine and chemokine levels in asthma patients belonging to cluster 1 or to cluster 2