
Figures & data
Figure 1 Schematic of the study design.
Abbreviations: EH, Easyhaler®; ICS, inhaled corticosteroid; OH, other inhaler.
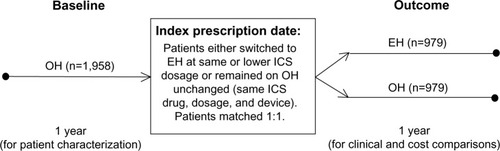
Table 1 Matching criteria
Table 2 Co-primary measures of clinical effectiveness
Table 3 Secondary measures of clinical effectiveness
Table 4 Comparison of co-primary measures of clinical effectiveness between the matched treatment groups during the outcome year
Figure 2 Comparison of average daily SABA dosages between baseline and outcome years for the matched treatment groups.
Abbreviations: EH, Easyhaler®; OH, other inhalers; SABA, short-acting β2 receptor agonist.
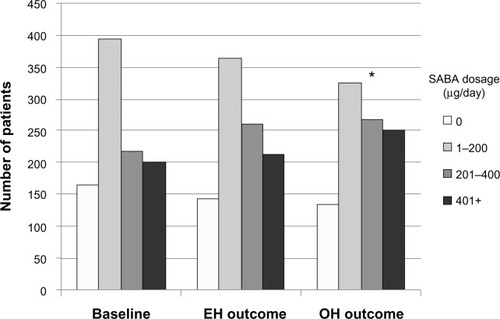
Table 5 Comparison of secondary measures of clinical effectiveness between the matched treatment groups during the outcome year
Table 6 Disaggregated components of the clinical effectiveness measures between the matched treatment groups during the outcome year
Figure 3 Comparison of average daily ICS dosages between baseline and outcome years for the matched treatment groups.
Abbreviations: BDP, beclomethasone dipropionate; EH, Easyhaler®; ICS, inhaled corticosteroid; IPD, index prescription date; OH, other inhalers.
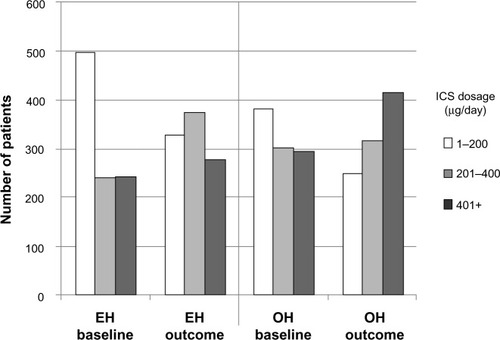
Table 7 Comparison of asthma-related health care costs (£/patient/year) between matched treatment groups for baseline and outcome years, including changes (Δ) in costs from baseline to outcome years
Figure S1 Potential confounders examined in the initial analysis.
Notes: aThe equations of Roberts et alCitation1 were used for patients >18 years of age and the equations of Rosenthal et alCitation2 were used for patients 6–18 years of age; bas described by Aylin et al.Citation3
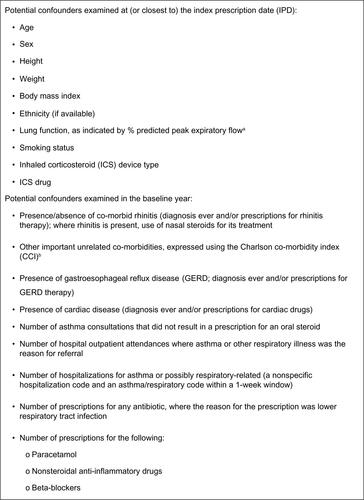
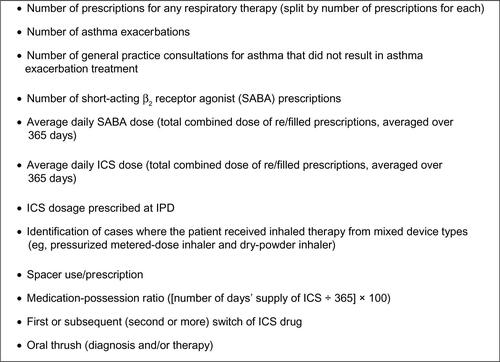
Table S1 Baseline patient characteristics: demographics and co-morbidities
Table S2 Baseline patient characteristics: disease severity and therapies
Table S3 Baseline patient characteristics: ICS drugs, dosages, and devices
Table S4 Patient characteristics during the outcome year: disease severity and therapies