Figures & data
Table 1 The G scale: the frequency scale for the symptoms of asthma and rhinosinusitis developed in Gunma
Figure 1 The relationship between asthma symptoms scores calculated by the G scale and ACT sum score.
Notes: (A) The asthma symptoms score is well correlated with ACT sum score. Spearman’s rank correlation coefficient is −0.743 (P<0.01). (B) The receiver operating characteristic curve is shown to determine a cut-off value of the asthma symptoms score calculated by the G scale, to identify asthmatic patients who are uncontrolled.
Abbreviations: ACT, asthma control test; G scale, frequency scale for the symptoms of asthma and rhinosinusitis developed in Gunma.
Abbreviations: ACT, asthma control test; G scale, frequency scale for the symptoms of asthma and rhinosinusitis developed in Gunma.
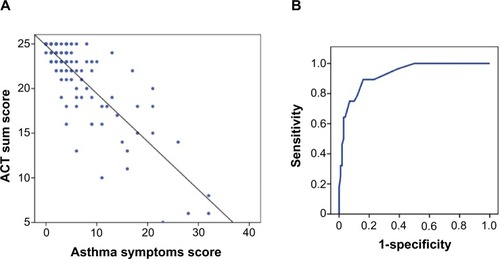
Figure 2 The relationship between FeNO and symptoms evaluated by the G scale.
Notes: (A) The frequency of daytime phlegm during the last month, evaluated by the G scale, is positively correlated with FeNO. Spearman’s rank correlation coefficient (ρ) is 0.130 (P=0.042). (B) FeNO is significantly higher in patients with daytime phlegm than in patients without it (*P<0.05). (C) The frequency of losing the sense of smell during the last month is also positively correlated with FeNO (ρ=0.219, P=0.001). (D) FeNO is significantly higher in patients who reported loss of the sense of smell during the last month than in patients who did not (**P<0.01).
Abbreviations: FeNO, fractional exhaled nitric oxide; ppb, parts per billion; G scale, frequency scale for the symptoms of asthma and rhinosinusitis developed in Gunma.
Abbreviations: FeNO, fractional exhaled nitric oxide; ppb, parts per billion; G scale, frequency scale for the symptoms of asthma and rhinosinusitis developed in Gunma.
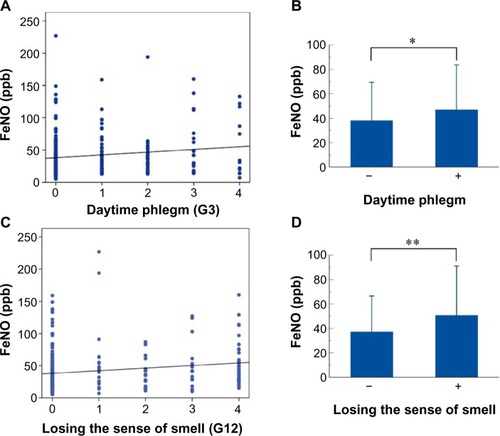
Figure 3 The relationship between asthma symptoms and rhinosinusitis symptoms.
Notes: The G scale scores for runny nose (G9), sneezing (G10), and nasal congestion (G11) are positively correlated with the asthma symptoms score. (A) Spearman’s rank correlation coefficient (ρ) is 0.116 between runny nose and asthma symptoms (P=0.009); (B) ρ=0.225 between sneezing and asthma symptoms (P<0.001); (C) ρ=0.271 between nasal congestion and asthma symptoms (P<0.001). (D) There is no significant correlation between the frequency of losing the sense of smell and asthma symptoms.
Abbreviation: G scale, frequency scale for the symptoms of asthma and rhinosinusitis developed in Gunma.
Abbreviation: G scale, frequency scale for the symptoms of asthma and rhinosinusitis developed in Gunma.
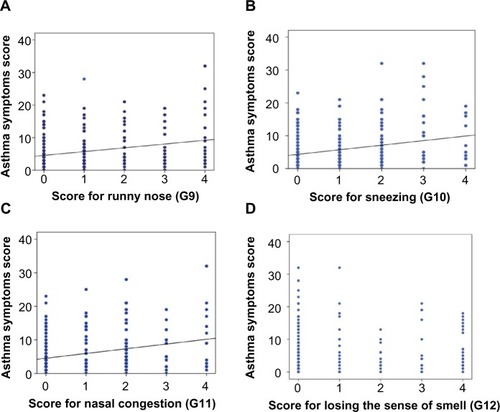
Figure 4 The relationship between upper abdominal symptoms and asthma symptoms.
Notes: The upper abdominal score, GERD score, and dyspepsia score are positively correlated with the asthma symptoms score. (A) Spearman’s rank correlation coefficient (ρ) is 0.471 between upper abdominal symptoms and asthma symptoms (P<0.001); (B) ρ=0.478 between GERD and asthma symptoms (P<0.001); (C) ρ=0.378 between dyspepsia and asthma symptoms (P<0.001).
Abbreviation: GERD, gastroesophageal reflux disease.
Abbreviation: GERD, gastroesophageal reflux disease.
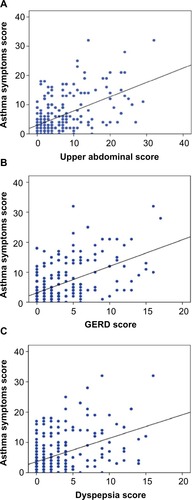
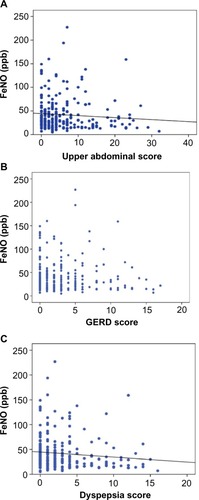
Figure 5 The relationship between upper abdominal symptoms and FeNO.
Notes: (A) Spearman’s rank correlation coefficient (ρ) is −0.148 between upper abdominal symptoms and FeNO (P=0.02); (C) ρ=−0.176 between dyspepsia and FeNO (P=0.005). (B) GERD score tends to be negatively correlated with FeNO (ρ=−0.106, P=0.097).
Abbreviations: FeNO, fractional exhaled nitric oxide; ppb, parts per billion; GERD, gastroesophageal reflux disease.
Abbreviations: FeNO, fractional exhaled nitric oxide; ppb, parts per billion; GERD, gastroesophageal reflux disease.