
Figures & data
Table 1 Clinical features that when present suggest the diagnosis of asthma or COPD
Figure 1 Relationship between Th2 Signature Score at baseline and improvement of hyperinflation after 30 months of treatment with inhaled fluticasone with or without added formoterol. Increased baseline Th2 score predicts a greater decrease in RV/TLC % predicted in the treatment group compared to placebo, t-value −2.43, P=0.019.
Notes: Reprinted with permission of the American Thoracic Society. Copyright © 2015 American Thoracic Society. Christenson SA, Steiling K, van den Berge M, et al. 2015. Asthma -COPD overlap. Clinical relevance of genomic signatures of type 2 inflammation in chronic obstructive pulmonary disease. Am J Respir Crit Care Med. Volume 191(7), pages 758–766.Citation3 The American Journal of Respiratory and Critical Care Medicine is an official journal of the American Thoracic Society.
Abbreviations: RV, residual volume; TLC, total lung capacity.
Abbreviations: RV, residual volume; TLC, total lung capacity.
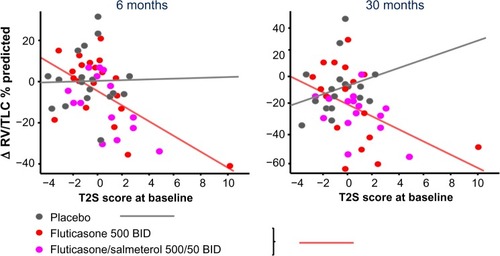
Table 2 Overview of studies investigating patients with the asthma–COPD overlap syndrome (ACOS)