Figures & data
Table 1 Patient and transfusion characteristics
Figure 1 ROC curve to identify the best cutoff probability value for Model 2.
Note: A cutoff probability of 0.5 provides maximal sensitivity + specificity.
Abbreviation: ROC, receiver operating characteristic.
Abbreviation: ROC, receiver operating characteristic.
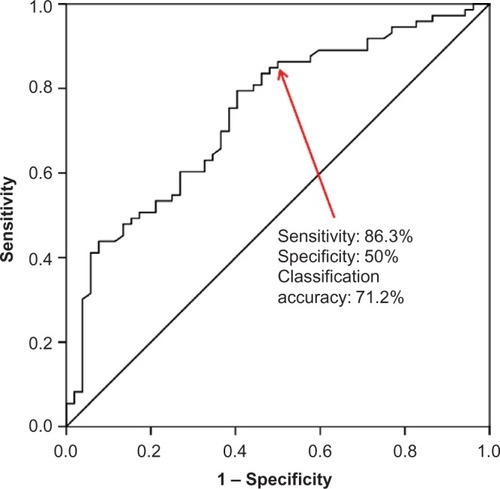
Figure 2 Summary of sequential steps involved in predicting high vs low response.
Notes: First, BSA is calculated using height and weight, as demonstrated by the DuBois and DuBois formula shown in the first box. Next, BSA is used in the regression model shown in the second box to derive H, which can subsequently be used to calculate the probability that the patient is a “high responder”, as shown in the third box.
Abbreviation: BSA, body surface area.
Abbreviation: BSA, body surface area.
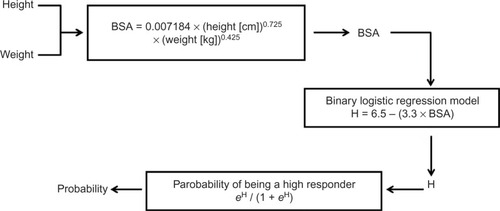
Table 2 Regression models to predict response level (high vs low) using variables with significant associations in univariate analysis
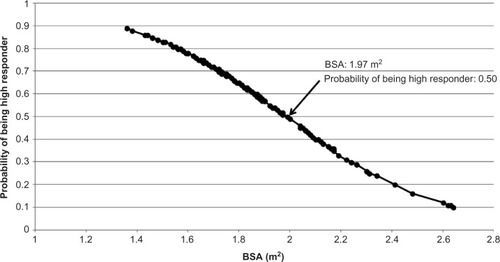
Figure 3 Nomogram to predict the probability of being a “high responder” based on BSA.
Note: This sigmoid nomogram was created to allow quick estimation of patients’ probability of being “high responder” based only on their BSA.
Abbreviation: BSA, body surface area.
Abbreviation: BSA, body surface area.