Figures & data
Table 1 Demographic data of patients with SCA compared with control
Table 2 The mean of biochemical and hematological and electrocardiographic data between group 1 and group 2 in adult patients with SCA
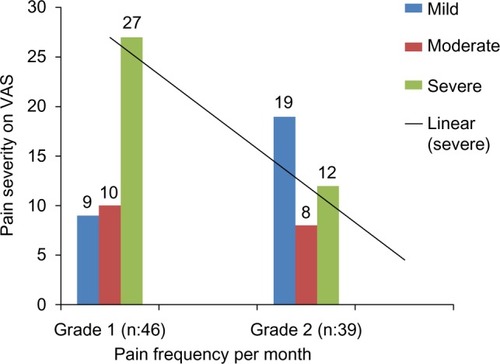
Figure 1 The mean of pain frequency per month for the two groups (1 and 2) in patients with SCA and pain intensity using VAS.
Abbreviations: SCA, sickle cell anemia; VAS, visual analog scale.