
Figures & data
Figure 1 PRISMA diagram of clinical trials of ruxolitinib in polycythemia vera.
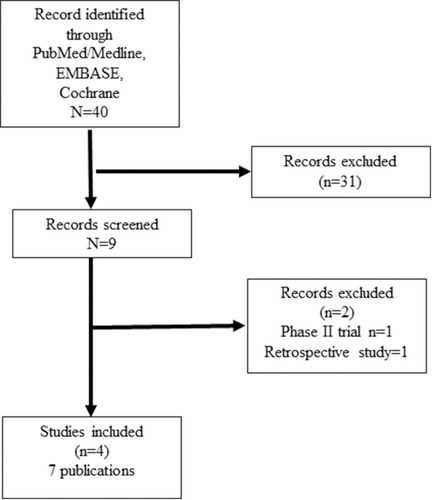
Table 1 Common Instruments Used In Myeloproliferative Neoplasms For Quantitatively Measuring Symptoms And Quality Of Life
Table 2 Published Studies Of Ruxolitinib In PV And Quality Of Life And PRO
Figure 2 Histograms comparing ruxolitinib with standard therapy or hydroxyurea alone in RESPONSE at 32 weeks, RESPONSE at 28 weeks and RELIEF at 16 weeks. Graph 1 depicts proportion of patients who achieved a ≥50% reduction in the MPN-SAF TSS. The RELIEF study only reported the TSS- C (Cytokine symptoms). Graph 2 depicts the proportion of patients who reported “very much” or “much improved” on the PGIC scale.
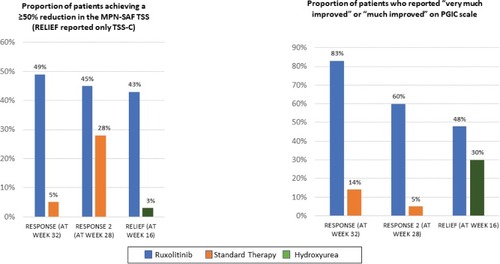
Table 3 Ongoing Clinical Trials In Polycythemia Vera Incorporating PRO In Efficacy Assessment