
Figures & data
Figure 1 Median values (plotted on a log scale).
Notes: Platelet counts (A), leukocyte counts (B), percentage (C), and absolute counts (D) of different lymphocyte subsets, percentages of T, NK, and γδ T lymphocytes expressing activation markers CD69 and HLA-DR (E) and memory CD4+ and CD8+ shown by expression of CD45RO and memory B cells by expression of CD27 (F) in peripheral blood at acute presentation in Malawian children either coinfected with HIV and cerebral malaria (red dots) or with cerebral malaria only (black dots).
Abbreviations: B, B cells; gdT, gamma/delta T cells; M, memory cells; NK, Natural killer cells; T, T cells; WBCs, white blood cells.
Abbreviations: B, B cells; gdT, gamma/delta T cells; M, memory cells; NK, Natural killer cells; T, T cells; WBCs, white blood cells.
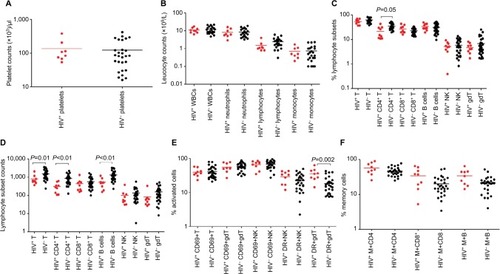
Figure 2 Median values (plotted on a log scale).
Notes: Platelet counts (A), leukocyte counts (B), percentage (C), and absolute counts (D) of different lymphocyte subsets, percentages of T, NK, and γδ T lymphocytes expressing activation markers CD69 and HLA-DR (E) and memory CD4+ and CD8+ shown by expression of CD45RO and memory B cells expressed by CDD27 (F) in peripheral blood at acute presentation in Malawian children either coinfected with HIV and severe malarial anemia (red dots) or with severe malarial malaria only (black dots).
Abbreviations: B, B cells; gdT, gamma/delta T cells; M, memory cells; NK, Natural killer cells; T, T cells; WBCs, white blood cells.
Abbreviations: B, B cells; gdT, gamma/delta T cells; M, memory cells; NK, Natural killer cells; T, T cells; WBCs, white blood cells.
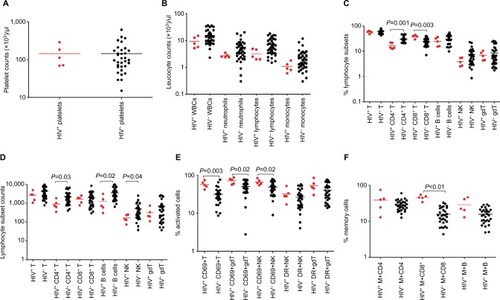
Table 1 Medians (25th and 75th percentiles) of different leukocyte and lymphocyte subsets
Table 2 Medians (25% and 75% percentiles) of different leukocyte and lymphocyte subsets
Table S1 Monoclonal antibodies used and corresponding cell populations
Table S2 Monoclonal antibodies and names of suppliers