Figures & data
Figure 1 Process of careening and selecting the studies based on the PRISMA statement.
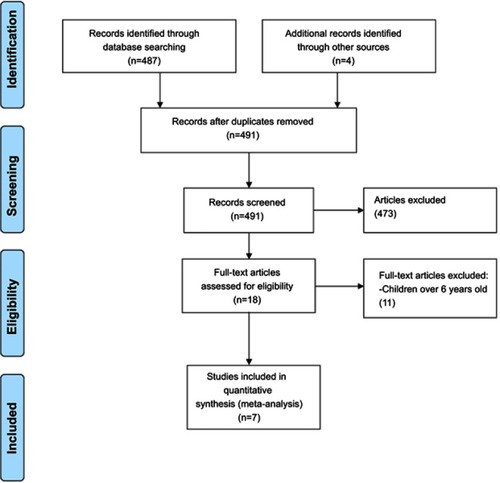
Table 1 Characteristics of the selected studies
Figure 2 Overall prevalence of iron deficiency anemia among Iranian children under 6 years of age. The 95% confidence interval for each study is shown in the form of horizontal lines around the central mean, the midpoint of the dotted line represents the mean of the overall score, and the lozenge shape shows the confidence interval of the prevalence of the disorder.
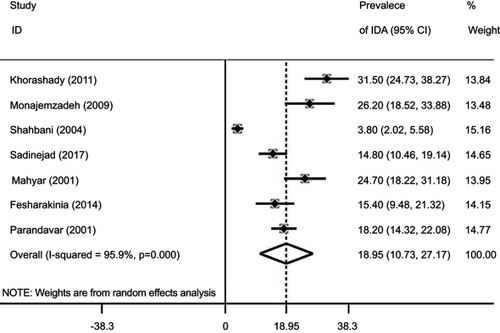
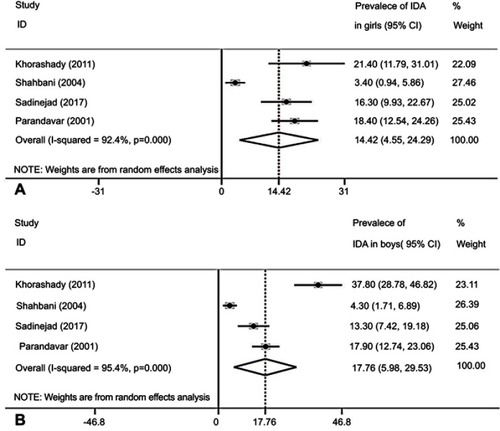
Figure 3 Prevalence of iron deficiency anemia in the Iranian girls (A) and boys (B) under 6 years of age. The 95% confidence interval for each study is shown in the form of horizontal lines around the central mean, the midpoint of the dotted line represents the mean of the overall score, and the lozenge shape shows the confidence interval of the prevalence of the disorder.