
Figures & data
Figure 1 Geographic area of the study, from El Minya Governorate in the North to Aswan in the south together with Al Wadi Al Jadeed (El Karaga) in the west and Red Sea in the east.
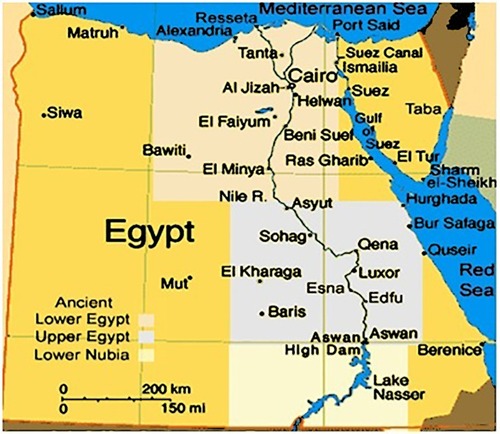
Figure 2 Age groups of the study patients. Group 1 = CML patients (n= 226) and group 2 = AML patients (n = 242).
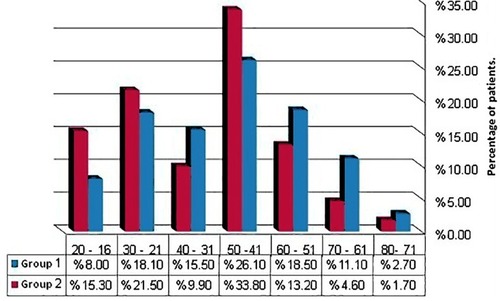
Table 1 Demographic Characteristics of Myeloid Leukemia Patients at SECI and AUH in the Period from January 2007 to December 2016 (Total Number = 468)
Figure 3 Distribution of the study patients over nine Governorates of Egypt. Group 1 = CML patients (n= 226) and group 2 = AML patients (n = 242).
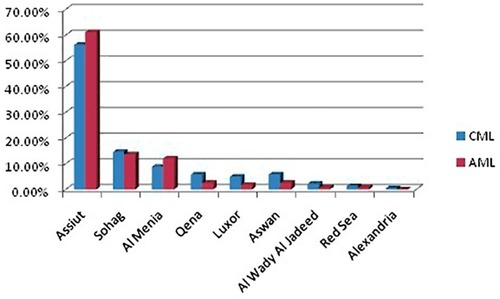
Figure 4 Pleukemic disorder of group 2 patients.
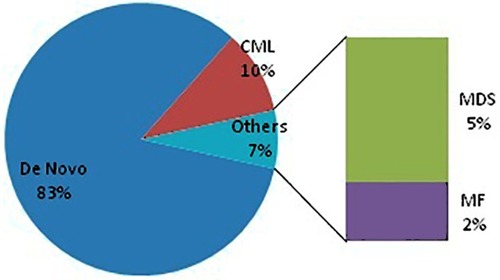
Figure 5 Distribution of leukemia phases and subtypes among the study patients. The upper panel showed subtypes of group 2 patients and the lower panel is phases of group 1 patients.
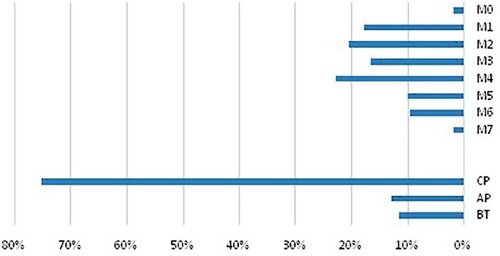
Table 2 Treatment Modalities for Myeloid Leukemia Patients at SECI and AUH in the Period January 2007–December 2016 (Total Number = 468)
Figure 6 Outcome of the study patients. The lower and upper panels showed outcome of groups 1 and 2, respectively.
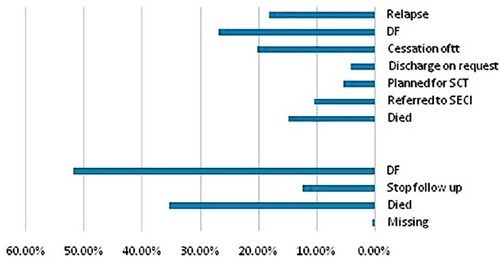
Figure 7 Kaplan–Meier survival analysis of group 1 patients.
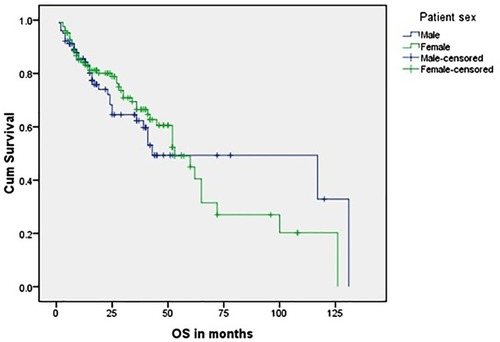
Table 3 Overall Survival of Group 1 Patients
Figure 8 Kaplan–Meier survival analysis of group 2 patients.
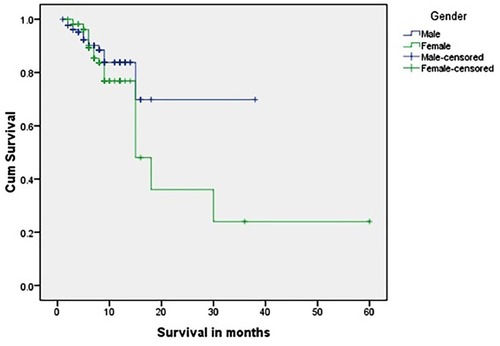
Table 4 Overall Survival of Group 2 Patients