
Figures & data
Figure 1 The trend of prevalence of TTIs in Iranian donated bloods from 2003 to 2017.
Note: The Y-axis scale is different in each graph.
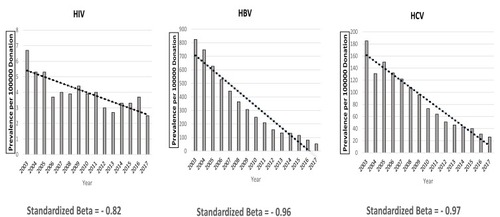
Figure 2 The geographic distribution of the period prevalence (2003–2017) of TTIs in Iranian donated bloods (per 100,000 donations).
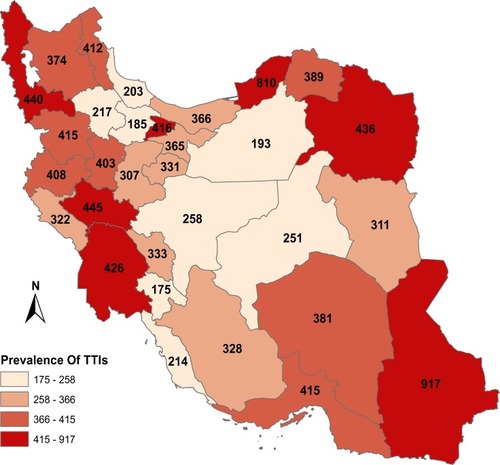
Figure 3 The interrupted time series analysis of HIV (A), HBV (B), HCV (C) in Iranian donated bloods.
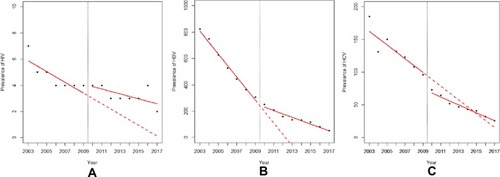
Table 1 ITS Parameters in the Trend of TTIs in Iranian Donated Bloods