
Figures & data
Figure 1 Differentially expressed miRNAs in CLL cells and normal cells.
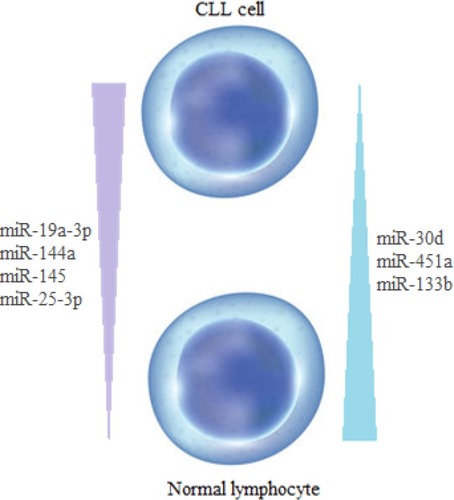
Figure 2 Median fold–change differences in alteration of miRNA expression between patient and control (normal). microRNAmiRNA expression analyzed using 2−ΔΔCt.
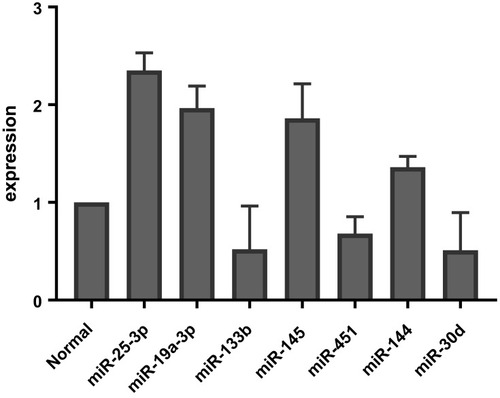
Figure 3 Deregulation of miR25-3p (A) and miR19a-3p (B) in CLL samples. Relative expression of miR-miR25-3p and miR-miR19a-3p in CLL samples compared to control. Expression normalized to 5s rRNA (endogenous control). Significant differences miR-miR25-3p between control and patients (****P=0.0001) and miR-miR19a-3p (***P=0.001). Results presented as mean ± SD of three independent experiments, each performed in triplicate.
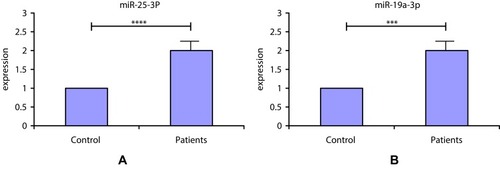
Table 1 Intracellular Targets and Functions of miRNAs