
Figures & data
Table 1 Presenting Symptoms in the Acutely Ill Groups
Table 2 Baseline Demographic and Clinical Characteristics in Clinical Sub-Groups
Figure 1 A box plot showing the distribution of baseline folate levels (log base 10) in the various groups: Non SCD, patients without sickle cell disease and confirmed malaria; SCD with positive blood C/S, SCD patients with a positive blood culture; SCD positive for malaria, SCD patients with confirmed malaria; SCD control, SCD patients in steady state. The box represents the interquartile range with median folate levels. The bars represent the maximum and minimum levels.
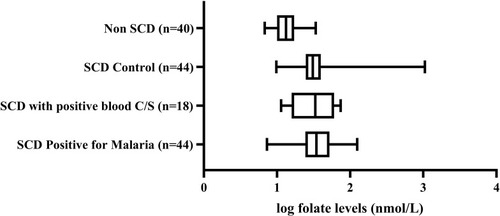
Figure 2 A box plot showing the distribution of folate (log base 10) at presentation (Day 0), and at follow-up on Day 14, among SCD patients with confirmed malaria. SCD positive for malaria, SCD children with confirmed malaria on Day 0; SCD positive for malaria on Day 14, SCD children with confirmed malaria on Day 14. The box represents the interquartile range with median folate levels. The bars represent the maximum and minimum levels.
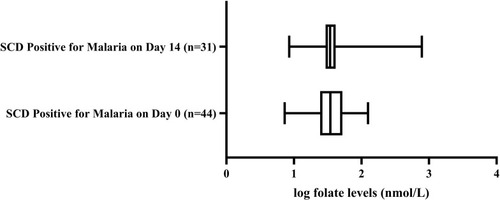
Table 3 Selected Characteristics of Participants with Normal or Elevated Folate