Figures & data

Table 1 Demographic Characteristics of Research Subjects
Table 2 Erythrocyte Profiles (Mean, Median, Standard Deviation, Minimum–Maximum)
Figure 1 Species of Plasmodium identified using Giemsa stain on the day of blood collection. (A) Plasmodium vivax; (B) Plasmodium falciparum; (C) Plasmodium ovale; (D) mix infection (Plasmodium falciparum and Plasmodium vivax) were identified in donor blood samples. All the parasites show normal morphology characterized by regular ring form, normal volume of cytoplasm and no halo formation both in trophozoite and gametocyte stages.
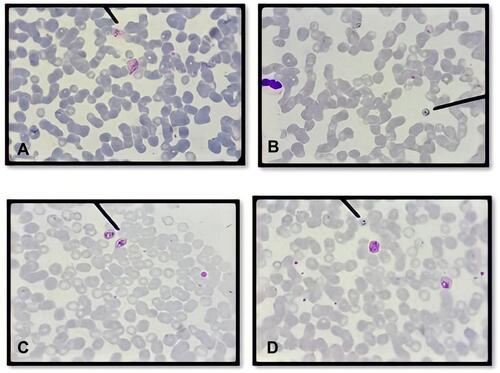
Figure 2 The presence of Plasmodium spp. identified using Giemsa stain on day 1, 7 and 14. (A) Several ring form of Plasmodium falciparum characteristic by acole form from day 1; (B) Amoeboid form of Plasmodium vivax from day 7; (C) Viable trophozoite of Plasmodium falciparum characteristic by ring form with tick cytoplasm and Maurer’s dot from day 14; (D) On day 21 no parasite was found. All the parasites show normal morphology characterized by regular nucleus, normal cytoplasmic volume and no halo formation representing live parasite.
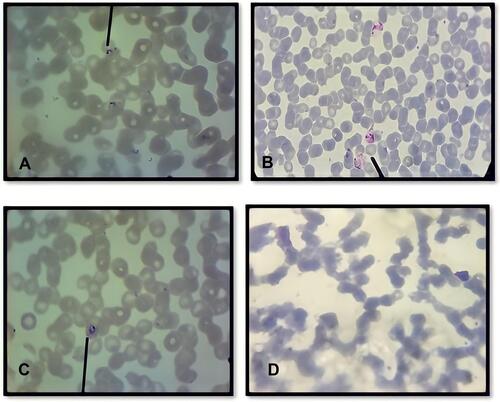
Figure 3 The number of positive samples in blood smears preparations from day 1 until day 28. The presence of parasites was reduced through the day observations.
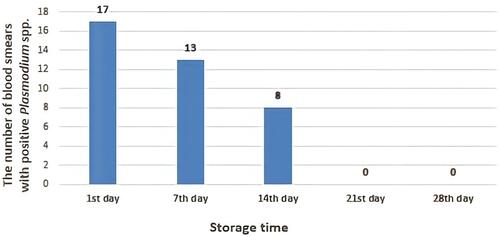
Figure 4 The number of red blood cells (RBCs) based on days of observation. In serial day observations, there was no significant difference in the decrease of number of RBCs between donor blood containing Plasmodium spp. and those of donor blood that did not contain Plasmodium spp. (p> 0.05; Independent T-test). However, the means of RBCs number through the day observations were reduced significantly with all p value = 0.000; Repeated ANOVA test and post-hoc Paired Wise Comparison test) in both groups. Different notations mean significant difference (p< 0.05).
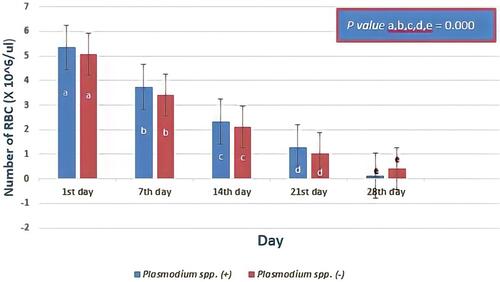
Figure 5 The level hemoglobin (Hb) levels based on day of observation. The decrease in the level of hemoglobin in donor blood containing Plasmodium spp. compared to that of donor blood did not contain Plasmodium spp. was not significantly different (p value > 0.05 Independent T-test). However, statistical results showed that there was a significant difference in the Hb profile at the five-day observation (p value <0.000, Friedman test and post-hoc Wilcoxon test) between the two groups. Different notations mean significant difference (p< 0.05).
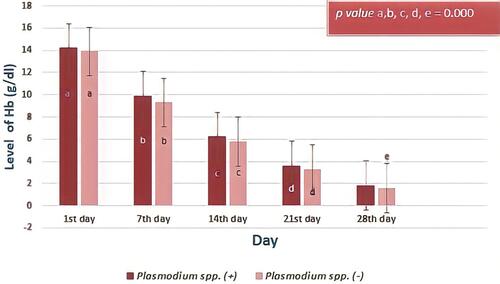
Figure 6 The percentage of Hematocrit (HCT) based on days of observation. Decreases in the percentage of hematocrit in donor blood containing Plasmodium spp. was not significantly different to those of donor blood that did not contain Plasmodium spp. (p> 0.05; Independent T-test). Among day observations, the level of hematocrit percentage were significantly different (all p value= 0.000, Repeated ANOVA test and post-hoc Paired Wise Comparison test) both in two groups. Different notations mean significant difference (p< 0.05).
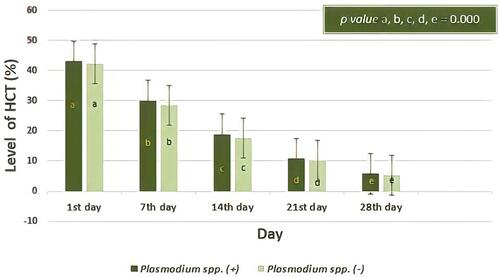
Figure 7 The level of Mean Corpuscular Volume (MCV) based on day of observation. The average level of MCV in donor blood containing Plasmodium spp. showed no significant difference compared to those in donor blood that did not contain Plasmodium spp. (p> 0.05; Mann–Whitney test). However, observation carried out from the first day to the twenty-eighth day of storage of level MCV showed a significant difference (all p value= 0.000, Friedman test and post-hoc Wilcoxon test) both in two groups. Different notations mean significant difference (p< 0.05).
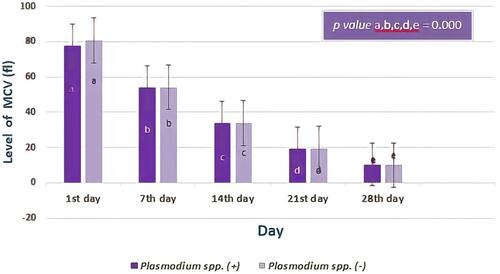
Figure 8 The level of Mean Corpuscular Hemoglobin (MCH) based on days of observation. The MCH of erythrocytes from donor blood containing Plasmodium spp. and those did not containing Plasmodium spp. was not different (all p value > 0.05; Independent T-test), but analysis on the level of MCH based on storage time showed a significant difference (all p value < 0.05; Repeated ANOVA test and post-hoc Paired Wise Comparison test) both in two groups. Different notations mean significant difference (p< 0.05).
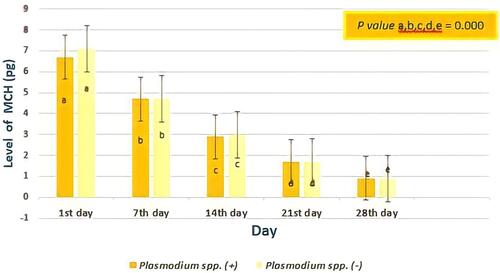
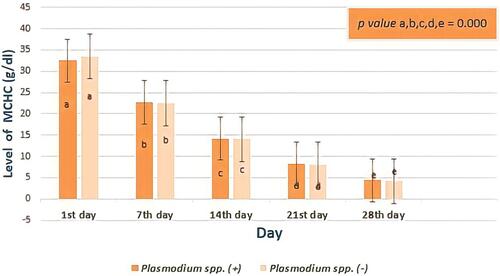
Figure 9 The levels of Mean Corpuscular Hemoglobin Concentration (MCHC) based on days of observation. There was no difference in the reduction of MCHC levels in donor blood containing Plasmodium spp. and those in donor blood that did not contain Plasmodiumspp. However, levels of MCHC based on storage time showed significant difference (all p value < 0.05, Repeated ANOVA test and post-hoc Wilcoxon test). Different notations mean significant difference (p<0.05).