
Figures & data
Figure 1 PRISMA flow diagram showing a summary of selection process.
Note: Copyright © 2009, Public Library of Science. Adapted with permission from Moher D, Liberati A, Tetzlaff J, Altman DG, PRISMA Group. Preferred reporting items for systematic reviews and meta-analyses: the PRISMA statement. PLoS Med. 2009;6(7):e1000097.
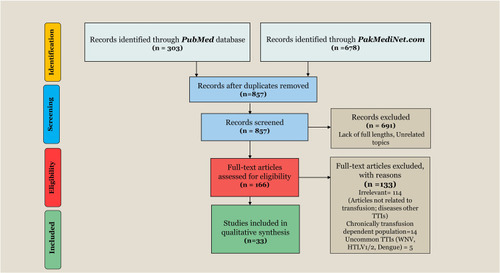
Table 1 Characteristics of Studies (n=33) Included in a Systematic Review
Table 2 Summary of Data from Studies Reporting the Frequency of Hepatitis B and Hepatitis C Among Blood Donors
Table 3 Summary of Data from Studies Reporting Frequency of HIV, Syphilis, and Malaria in Blood Donors