Figures & data
Figure 1 (A and B) Mean ABR, any bleeding, after matching for all selected baseline variables;†forest plot represents relative treatment effects presented as IRR with 95% CI.
Notes: †Age, number of target joints, proportion of patients with prior prophylaxis, ethnicity (proportion of white patients) and treatment duration (weeks); ‡Effective sample size; ¶Data from HAVEN 3; §Data from HAVEN 4
Abbreviations: ABR, annualized bleeding rate; CI, confidence interval; IRR, incidence rate ratio; Q1W, once a week; Q2W, once every 2 weeks; Q4W, once every 4 weeks.
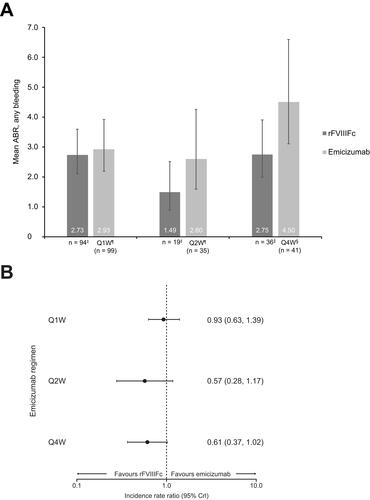
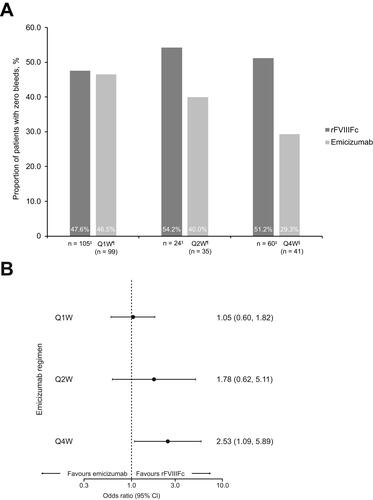
Figure 2 (A and B) Proportion of patients with zero bleeds after matching for all selected baseline variables; †forest plot represents relative treatment effects presented as OR with 95% CI.
Notes: †Age, number of target joints, proportion of patients with prior prophylaxis, ethnicity (proportion of white people) and treatment duration (weeks); ‡Effective sample size; ¶Data from HAVEN 3; §Data from HAVEN 4.
Abbreviations: CI, confidence interval; OR, odds ratio; Q1W, once a week; Q2W, once every 2 weeks; Q4W, once every 4 weeks.