
Figures & data
Figure 1 Changes in thrombin generation depending on FXIII antigen. (A) Before starting steroids. Baseline FXIII of 5%. (B) The patient received steroids for 1 week. Baseline FXIII of 34%. (C) The patient received steroids for 2 weeks. Baseline FXIII of 45%. Reference within normal parameters is shown in green and patient´s sample in blue.
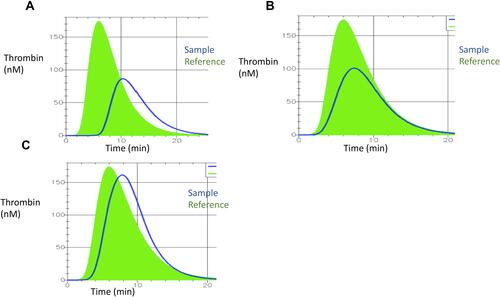
Figure 2 Changes in thromboelastography. (A) The patient received corticosteroids for 1 week. (B) The patient received steroids for 2 weeks.
Abbreviations: CT, clotting time; CFT, clot formation time; MCF, maximum clot firmness.
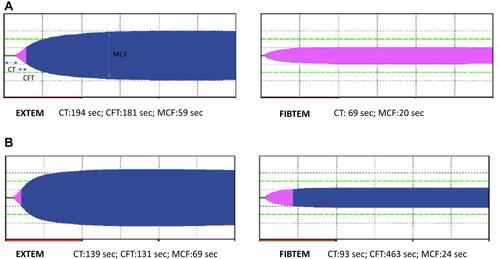
Table 1 Changes in Hemostatic Parameters Throughout Time