Figures & data
Table 1 Subject Characteristics
Table 2 ROC Analysis of NLR
Figure 1 Receiver operating characteristic (ROC) analysis of NLR. AUC was 72.6% (63.4%-81.8%). NLR optimal cut-off value was 5.12 (n=118).
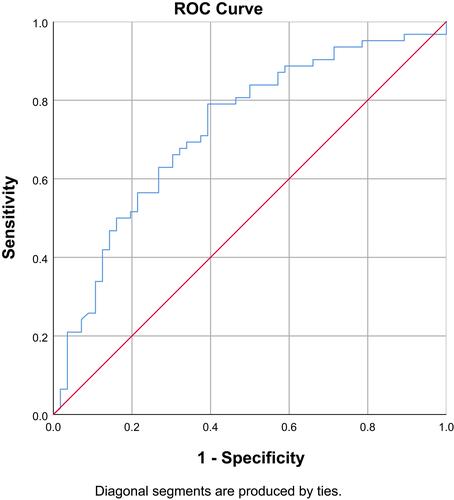
Figure 2 Sensitivity and specificity analysis of NLR. NLR optimal cut-off value was determined to be 5.12 (n=118).
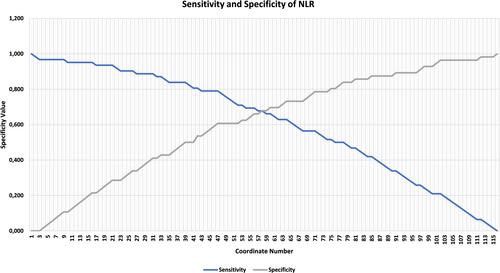
Table 3 ROC Analysis of D-Dimer
Figure 3 Receiver operating characteristic (ROC) analysis of D-dimer. AUC was 70.4% (60.8%–80.0%).
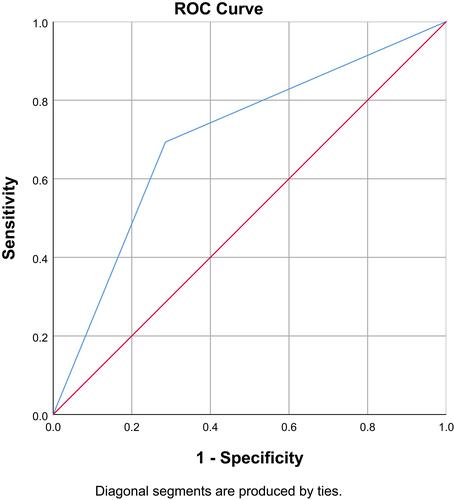
Table 4 ROC Analysis of NLR and D-Dimer
Figure 4 Receiver operating characteristic (ROC) analysis of NLR and D-dimer. AUC is 76.1% (67.3%–84.8%).
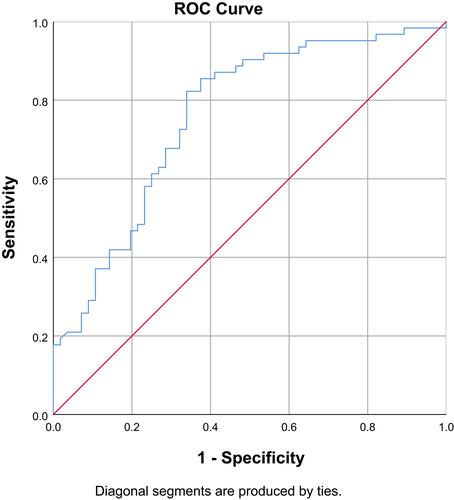
Figure 5 Overall model quality.
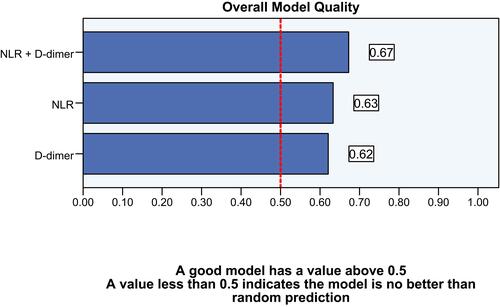
Table 5 Statistical Comparison of Obtained AUCs
Table 6 Sensitivity and Specificity of NLR and D-Dimer in Low Probability and High Probability Groups
Table 7 Univariate Analysis of Variables
Table 8 Step 1 of Multivariate Analysis with Interaction Variable
Table 9 Step 4 of Multivariate Analysis with Interaction Variable
Table 10 Best Model of Multivariate Analysis
Table 11 Hosmer and Lemeshow Test
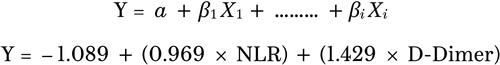
Figure 6 Logistic regression formulae obtained from best model of multivariate analysis for odds ratios of having DVT.