Figures & data
Figure 1 India map showing sampled area. The distance between Samad Rakchan and Bylakuppe is ~2320 km.
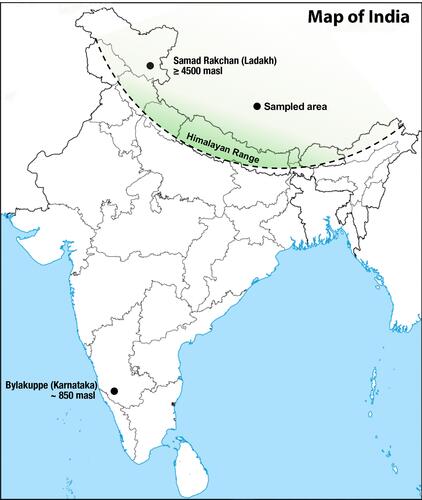
Table 1 Description of Anthropometric Parameters of the Subjects (n=168); Data is Expressed in Mean ± SD Format
Figure 2 Age distribution among (A) high altitude and (B) low altitude participants.
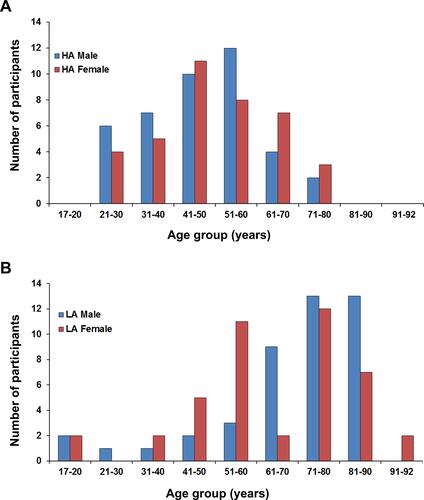
Table 2 Description of Various Hematological Parameters in the Subjects; Data is Expressed in Mean ± SD Format
Figure 3 Various hematological parameters of high and low altitude Tibetan males and females: (A) RBC, (B) HCT, (C) Hb, (D) MCV, (E) MCH and (F) MCHC. Blue and maroon horizontal lines represent mean ± SD. ****p <0.0001, *p = 0.01–0.05.
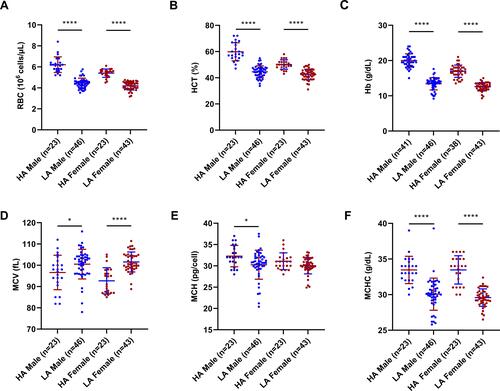
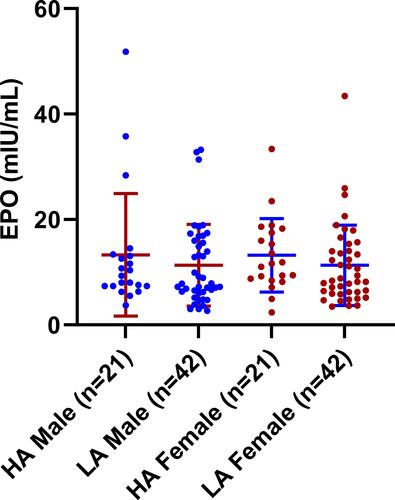
Table 3 Description of Serum EPO and Hb in the Subjects; Data is Expressed in Mean ± SD Format
Table 4 Description of BMI Among Participants Belonging to Three Different Age Categories; Data is Expressed in Mean ± SD Format
Table 5 Description of Hemoglobin Concentration Among Participants Belonging to Three Different Age Categories; Data is Expressed in Mean ± SD Format
Figure 4 Hemoglobin concentration (Hb) among age-categorized participants: (A) in the age range of 17–40 years, (B) 41–60 years, (C) 61–80 years. ****p <0.0001, ***p = 0.0001–0.001, **p = 0.001–0.01. Blue and maroon horizontal lines represent mean ± SD.
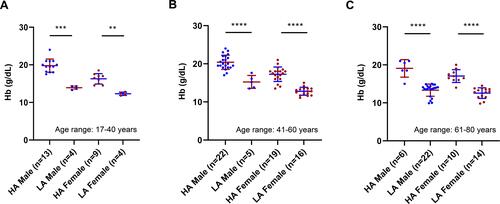
Figure 5 Distribution of serum erythropoietin (EPO) level among participants.