
Figures & data
Table 1 Clinical and Laboratory Characteristics of Patients with CLL Based on DAT Status
Table 2 Associations of CD38 and ZAP-70 with DAT
Table 3 Proportions of the Therapy Lines in DAT-Positive and DAT-Negative Cases
Table 4 Response Assessment-Based DAT
Table 5 Multivariate Analysis of Overall Response to the First-Line Therapy
Figure 1 Kaplan–Meier estimates of overall survival in CLL patients according to DAT status (P = 0.2).
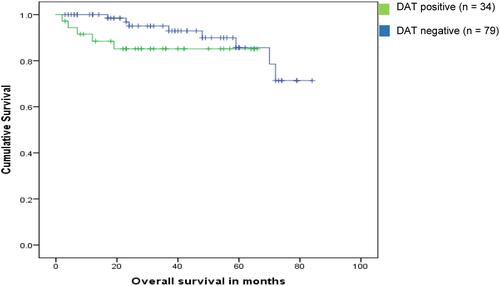
Figure 2 Kaplan–Meier estimates of PFS in CLL patients according to DAT status (P = 0.004). Median PFS of positive and negative cases: 40.9 and 84 months, respectively.
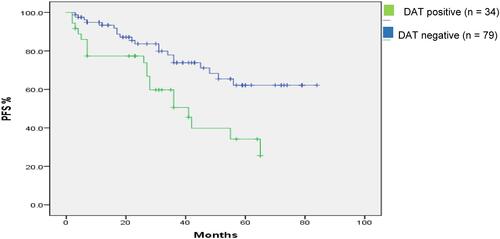
Table 6 Univariate Cox Regression Hazard Analysis of Possible Predictors of PFS
Figure 3 Kaplan–Meier estimates of PFS in DAT-positive CLL patients according to AIHA development (P = 0.9).
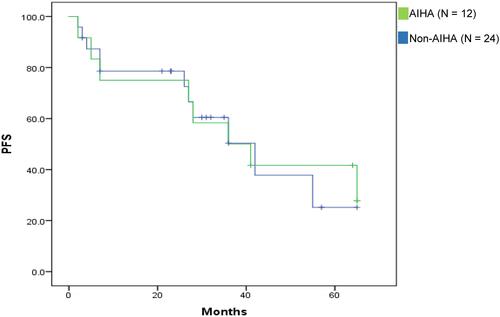
Table 7 Studies About the Prognostic Impact of a Positive DAT on CLL Outcomes