Figures & data
Table 1 Baseline Clinical Characteristics of the Study Population Before and After Propensity Score Matching
Table 2 Safety and Effectiveness Endpoints and Anticoagulant Treatment Discontinuation Rate in the NOACs and VKAs Groups
Figure 1 Kaplan Meier survival curve analysis estimating the risk of major bleedings in VKA and NOAC groups.
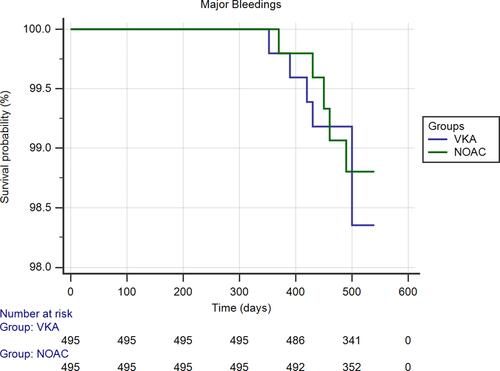
Figure 2 Kaplan Meier survival curve analysis estimating the risk of thromboembolic events in VKA and NOAC groups.
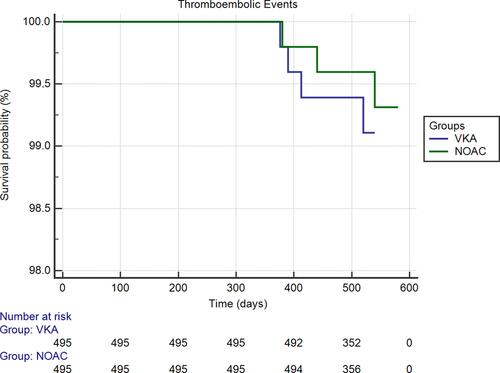
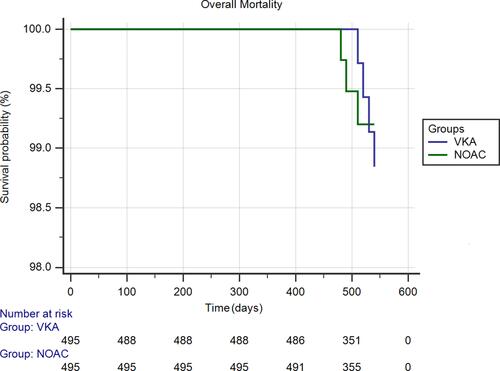
Figure 3 Kaplan Meier survival curve analysis estimating the risk of overall mortality in VKA and NOAC groups.