Figures & data
Figure 1 Flow cytometry analysis of CD105 positive case. (A) Dot plot showed gating using CD45/SSC strategy, blast cells (R1), normal lymphocytes (R2) and granulocytes (R3). (B) Scatter dot plot showing blast cells positive for CD105 expression in combination with normal lymphocytes and granulocytes negative for CD105 expression. (C) Dot plot showing the mouse IgG1 isotypic negative control. (D) Dot plot showing positive CD105 expression on gated blast cells. (E) Histogram showing positive CD105 (solid violet curve) versus negative control (green colored curve).
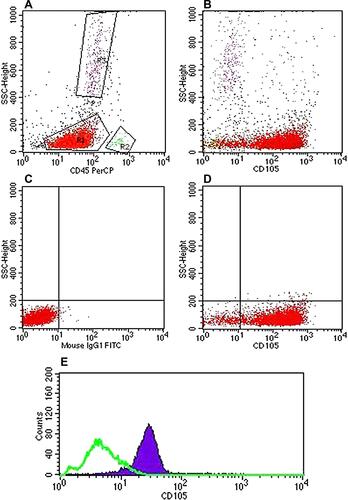
Figure 2 Flow cytometry of analysis of CD105 negative case. (A) Dot plot showed gating using CD45/SSC strategy, blast cells (R1), normal lymphocytes (R2) and granulocytes (R3). (B) Scatter dot plot showing blast cells, normal lymphocytes and granulocytes all negative for CD105 expression. (C) Dot plot showing the mouse IgG1 isotypic negative control. (D) Dot plot showing negative CD105 expression on gated blast cells. (E) Histogram showing negative CD105 (solid violet curve) versus negative control (green colored curve).
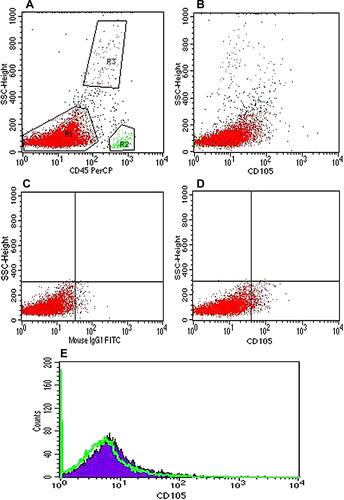
Table 1 The Pattern and Range of CD105 Expression in B-ALL Cases as Regards Risk Stratification
Table 2 The Impact of CD105 Expression Pattern on B-ALL Patient’s Characteristics
Table 3 Correlation Between CD105 SFIs and CD105% with Different Parameters
Table 4 Univariate and Multivariate Analysis for the Parameters Affecting Response to Induction Therapy
Table 5 Performance (AUC, Sensitivity, Specificity) for CD105 SFIs and CD 105% to Discriminate Between Poor Responder (n=10) and Good Responder (n=51)
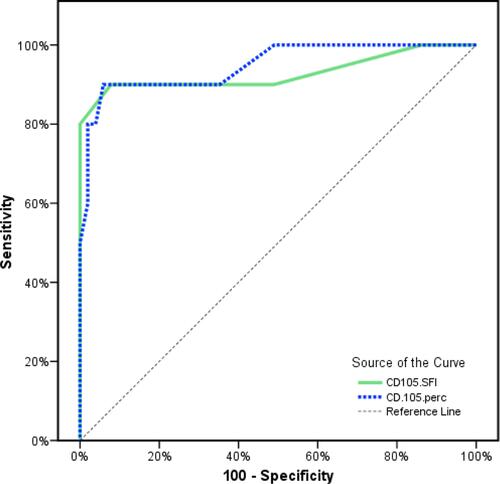
Figure 3 ROC curve for CD105 SFIs and CD105%to discriminate between poor and good responder.