Figures & data
Figure 1 Phenotypic determination of C. pneumoniae-activated TEMs. (A) Total CD4+ and CD8+ TEMs. (B) CD4+CD154+ and CD8+CD4+ TEMs. See materials and methods. Blue box: CD4+ T cells. Red box: CD8+ T cells.
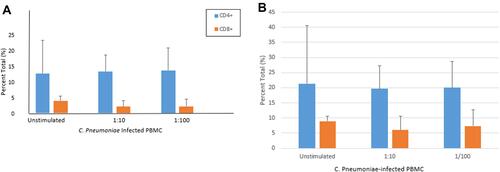
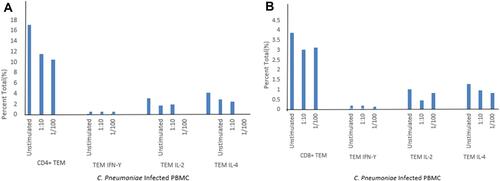
Figure 2 Phenotypic determination of C. pneumoniae-activated TEMs. (A) CD4+ IL-2+, CD8+ IL-2+ TEMs. (B) CD4+IL-4+, CD8+IL-4+ TEMs. (C) CD4+IFN-γ+, CD8+IFN-γ+ TEMs. See materials and methods. Blue box: CD4+ T cells. Red box: CD8+ T cells.
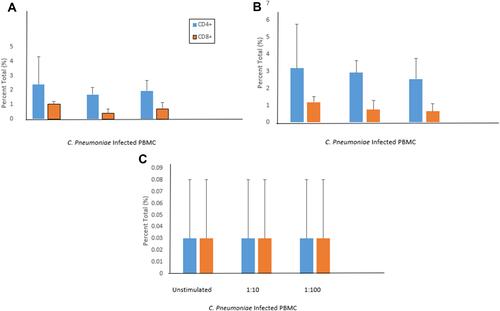
Figure 3 C. pneumoniae-induced IFN–γ levels in cell culture supernatants. C. pneumoniae induced IFN-γ responses were measured on days 3, 5 and 7 post-infection (ELISA) (N=4). See materials and methods. Data are reported as pg/mL.
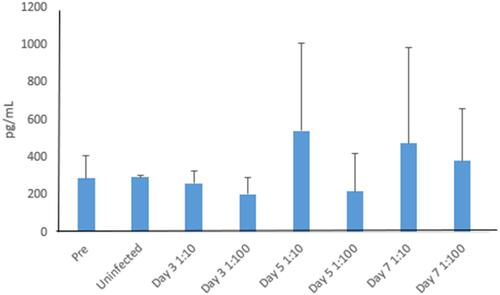
Figure 4 C. pneumoniae-induced IFN–γ levels stratified according to CD4+ and CD8+ TEMs. (A) Numbers of CD4+154+ and CD8+CD154+ TEMs (N=4), (B) numbers of CD4+154+ and CD8+CD154+ TEMs in representative IFN-γ positive and IFN-γ negative subject. See materials and methods. Blue box: CD4+ T cells. Red box: CD8+ T cells.
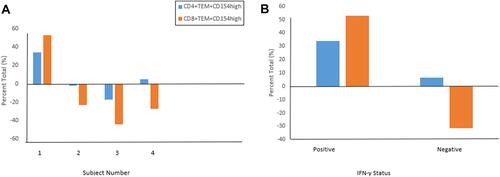
Figure 5 CD4+ and CD8+ TEMs stratified according to IFN-γ levels in IFN-γ positive subject. (A) CD4+, CD4+ IFN-γ+, CD4+IL-2+ and CD4+IL-4+ TEMs. (B) CD8+, CD8+ IFN-γ+, CD8+IL-2+ and CD8+ IL-4+ TEMs. See materials and methods.
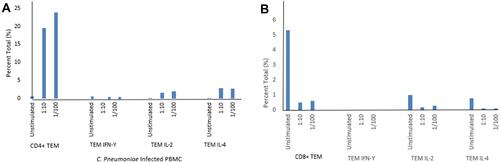
Figure 6 CD4+ and CD8+ TEMS stratified according to IFN-γ levels in IFN-γ negative subjects. (A) CD4+, CD4+ IFN-γ +, CD4+IL-2+ and CD4+IL-4+ TEMs. (B) CD8+, CD8+IFN-γ +, CD8+IL-2+ and CD8+IL-4+ TEMs. See materials and methods.