Figures & data
Table 1 Umbilical Cord Blood (UCB) Donors for HSC Isolation
Table 2 Bone Marrow Donors for MSC Isolation and Expansion
Figure 1 Structure of 3D cultures. Structures at days 5, 10 and 15 in three O2 conditions (1%, 3% and 21% O2 levels). (A) Experimental condition: MSC-HSC-EC, (B) Endothelial cells control: MSC-HSC, (C) Mesenchymal cells control: Fb-HSC-EC. (Olympus® CKX31, 10×) (scale bar: 100 μm).
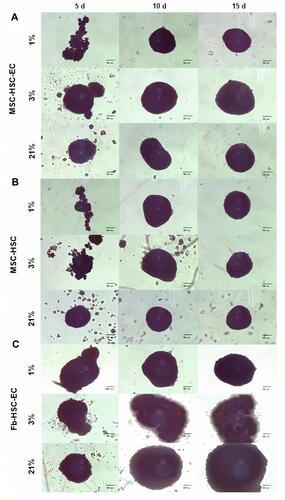
Figure 2 Volume and sphericity index (SI) of 3D cultures. (A–C) Volume after 5, 10 and 15 days. Friedman tests were performed to compare O2 concentrations: 5, 10 and 15 days. Friedman tests were performed to compare MSC-HSC-EC structures and controls: 5 days (p=0.0278), 10 days and 15 days (p>0.,05). (D–F) Sphericity Index (SI) after 5, 10 and 15 days. Friedman tests were performed to compare O2 concentrations and MSC-HSC-EC structures vs controls after 5, 10 and 5 days (p>0.,05).
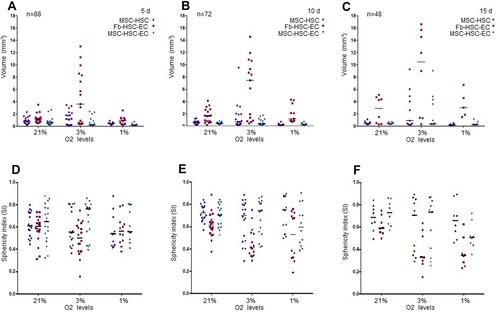
Figure 3 Viability of 3D cultures. (A and B) Cell viability in 1% O2, (C and D) Cell viability in 3% O2, (E and F) Cell viability 21% O2. (B, D, F) LIVE/DEAD® viability kit. Red: dead cells, Green: live cells. Olympus confocal microscope FV1000, 20× (scale bar: 100μm).
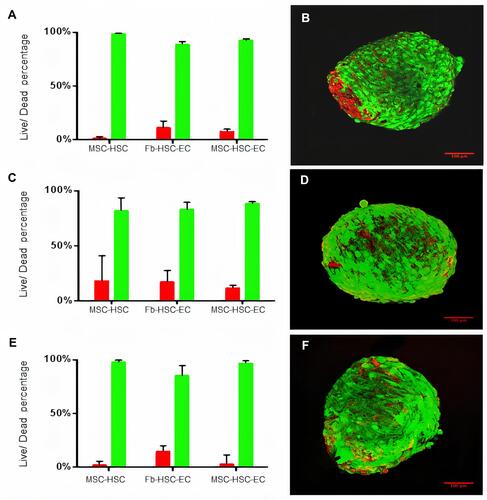
Figure 4 Histological characterization of 3D structures. (A) Hematoxylin and eosin stain (20×, Olympus® CX21), (B) Vimentin expression of MSC-HSC-EC structures after 15d with 3% O2 (20×, Olympus® CX21), (C) Negative control for vimentin (brain tissue) (10×, Olympus® CX21), (D) Positive control for vimentin (lymph node tissue) (10×, Olympus® CX21).
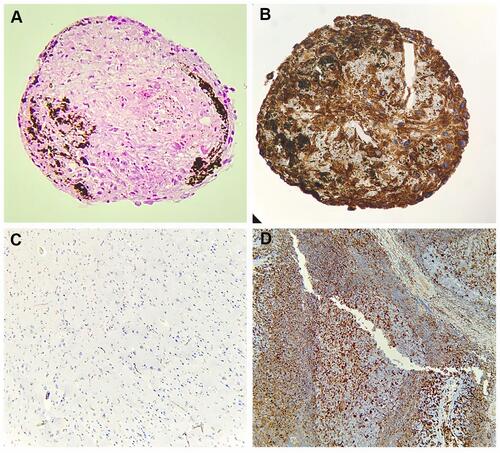
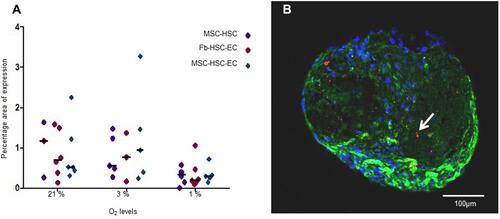
Figure 5 Ki67 expression in 3D structures. (A and B) Ki67 expression of MSC-HSC-EC structures after 15 days and 1% O2 by immunochemistry (arrows) (100×, Olympus® CX21), (C) Ki67 negative control by immunochemistry (brain tissue) (10×, Olympus® CX21), (D) Ki67 positive control by immunochemistry (lymph node tissue) (10×, Olympus® CX21), (E) Ki67 expression by confocal microscopy (percentage area of expression), (F) Paraffin section (3 μm thick) of MSC-HSC-EC structure analyzed by confocal microscopy (Magenta: Ki67, green: α-tubulin, and blue: DAPI-nuclei) (40×, Olympus confocal microscope FV1000).
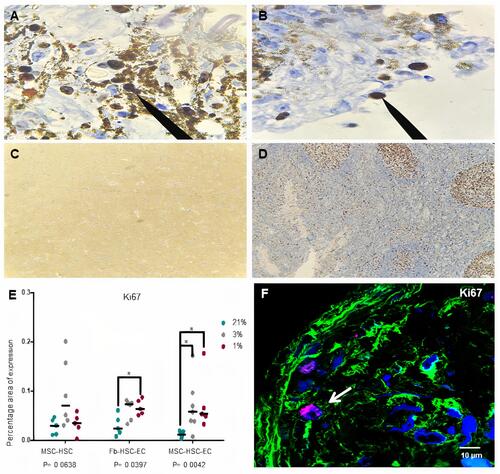
Figure 6 Hematopoietic antigens expression in 3D structures. (A and B) CD34 antigen, (C and D) CD133 antigen, (E and F) CD33 antigen, (G and H) CD7. (B, D, F, H) Paraffin section (3 μm thick) of MSC-HSC-EC structure analyzed by confocal microscopy after 15 days. Magenta or red: hematopoietic antigen (arrows), green: α-tubulin, and blue: DAPI-nuclei (40X, Olympus confocal microscope FV1000).
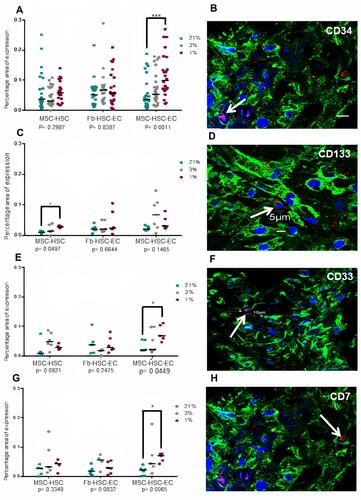
Figure 7 ROS levels in 3D structures. (A) ROS expression area in structures cultivated in 1%, 3% and 21% O2. Differences between MSC-HSC-EC and controls, P> 0.9999, as determined by Friedman tests; differences between O2 concentrations, P = 0.1944, as determined by Friedman tests. (B) Paraffin section (3 μm thick) of MSC-HSC-EC culture stained with CellROX®. Green: α-Tubulin, blue: DAPI (nuclei), and red: ROS (20×, Olympus confocal microscope FV1000).