Figures & data
Figure 1 Growth of OS-SCs isolated from a single human osteosarcoma sample with its high grade and osteoblastic essential clinical characteristics obtained from biopsy before the chemotherapy treatment. (A) OS-SCs fibroblast-like cells grow 60% in 3rd passage; (B). OS-SCs fibroblast-like cells grow 90% confluent in 4th passage; (C) 90% confluent cell growth of OS-SCs in 5th passage 5; (D) 90% growth of OS-SCs in 6th passage; (E) OS-SCs positively expressed by CD133+ expression; (F) OS-SCs positively expressed by CD44+ expression; (G) OS-SCs stained with DAPI; (H) The comparison between normal cells and cells stained with DAPI.
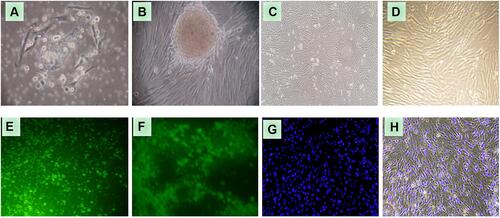
Figure 2 The sensitization of PBMCs. (A) Sensitization of PBMCs with MSCs secretome and CSF-2 after 2 days; (B) OS-SCs co-cultivated with PMBCs; (C) Co-cultivation of OS-SCs and PBMCs sensitized with MSCs secretome showed by the appearance of endocytosis; (D) Sensitized PBMCs with CSF-2 after 6 days OS-SCs induced apoptosis.
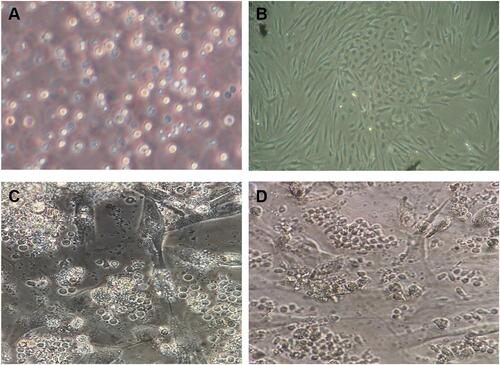
Figure 3 Co-cultivation of OS-SCs with sensitized PBMCs with MSCs secretome or CSF-2. (A) The level of TNF-α in each group in 2 days; (B) The level of sTRAIL in each group of PBMCs sensitized with MSCs secretome; (C) The level of sTRAIL in each group of PBMCs sensitized with CSF-2. *Information: signification p-value at p<0.05.
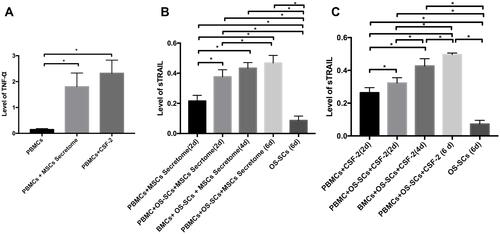
Figure 4 The result of Annexin V labeled with FITC binding was positively detected in OS-SCs in each group. (A1 and A2) Before and after the co-cultivation of OS-SCs and PBMCs sensitized with MSCs secretome; (B1 and B2) Before and after the co-cultivation of OS-SCs and PBMCs sensitized with CSF-2; (C1 and C2) Before and after the co-cultivation of OS-SCs and PBMCs sensitized with MSCs secretome and CSF-2. The observation was carried out by utilizing the light inverted microscope with 20x magnification; (D) The cell quantification of Annexin V binding in each group. *Information: significant at p<0.05.
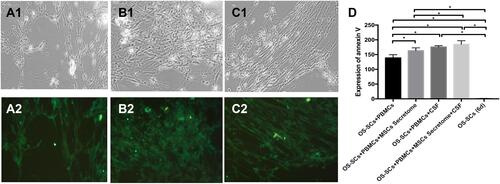
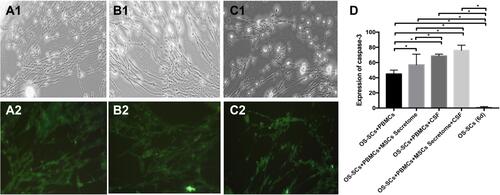
Figure 5 The result of caspase-3 expression labeled with FITC was expressed positively in OS-SCs in each group. (A1 and A2) Before and after the co-cultivation of OS-SCs and PBMCs sensitized with MSCs secretomes; (B1 and B2) Before and after the co-cultivation of OS-SCs and PBMCs and sensitized with CSF-2; (C1 and C2) Before and after the co-cultivation of OS-SCs and PBMCs sensitized with MSCs secretomes and CSF-2. The observation was carried out by utilizing the light inverted microscope with 20x magnification. (D) The cell quantification that expressed caspase-3 in each group. *Information: significant at p<0.05.

Figure 6 The result of caspase-8 expression labeled with FITC was demonstrated positively in OS-SCs in each group. (A1 and A2) Before and after OS-SCs co-cultivated with PBMCs and sensitized with MSCs secretomes; (B1 and B2) Before and after OS-SCs co-cultivated with PBMCs and sensitized with CSF-2; (C1 and C2) Before and after OS-SCs co-cultivated with PBMCs and sensitized with MSCs secretomes and CSF-2. The observation was carried out by employing the light inverted microscope with 20x magnification. (D) The cell quantification that expressed caspase-8 in each group. *Information: significant at p<0.05.