Figures & data
Figure 1 C1498 derived EVs induce splenocyte and CD3+ proliferation. Splenocytes (1 x 10⁵ cells) were cultured with PBS, C1498 cells, different concentrations of C1498 derived EVs (C1 = high, C2 = low), or both C1498 cells and C1498 derived EVs. (A) Comparison of tritiated thymidine incorporation (mean ± SD) of combined splenocyte proliferation activity from splenocytes isolated from naïve mice (control) and splenocytes isolated from EV immunized mice (treated) (mean ± SD). (B) CD3+ splenocytes from PBS injected, C1498 derived EV immunized, or C1498 cell immunized mice were labeled with CFSE and co-cultured in vitro with medium, C1498 derived EVs, or C1498 cells. On day 4 the splenocytes were analyzed by flow cytometry and the number of CFSE low cells (proliferating cells) were measured as fold difference from PBS injected naïve mice cultured with medium (mean ± SD). (C) Representative flow cytometry plots of CFSE labeled splenocytes stained with anti-CD3 after four days of culture. CD3+ expression on the vertical axis and CFSE expression on the horizontal axis. Column 1: cells underwent in vivo injection of PBS, column 2 cells underwent in vivo injection of C1498 derived EVs, column 3: cells underwent in vivo injection of C1498 cells. Row 1: cells underwent in vitro culture with medium, row 2: cells underwent in vitro culture with C1498 derived EVs, row 3: cells underwent in vitro culture with C1498 cells. Left upper quadrant represents CD3+ CFSElo population. Left bottom quadrant represents CD3- CFSElo population. Asterisks indicate significant differences (*p < 0.05, **p<0.01).
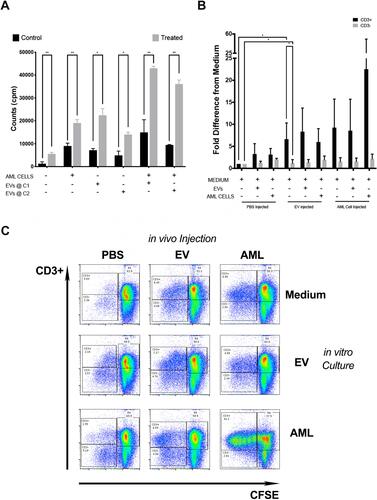
Figure 2 C1498 derived EVs preferentially activate CD8+ T cells and C1498 derived EV immunization increases lytic effector function. CFSE labeled splenocytes from in vivo PBS injected, C1498 derived EV immunized, or C1498 cell immunized mice were co-cultured in vitro with medium, C1498 derived EVs, or C1498 cells. On day 4 the cultures were harvested and stained with a panel of antibodies including anti-CD3, anti-CD8, anti-CD4, and underwent immunophenotypic analysis. (A) Table shows the fraction of CD8+ and CD4+ CFSElo population that are CD8+ cells. (B) Flow cytometry bar graphs of measured CD3+ CD8+ proliferation of each condition. Experiment repeated at least 3 times. Data is presented as fold difference in CFSE low cells (proliferating cells) from PBS injected naïve mice cultured with medium (mean ± SD). (C) Splenocytes isolated from C57BL/6J mice 7- and 14-days following injection with PBS, C1498 derived EVs, or AML cells were co-cultured in vitro with PBS, C1498 derived EVs, or AML cells for five days and the responding cells were tested for their ability to lyse 51Cr labeled C1498 cells. Data is presented as LU/106 effector cells and represents replicates from 4 experiments. Asterisks indicate significant differences (*p < 0.05, **p<0.01).
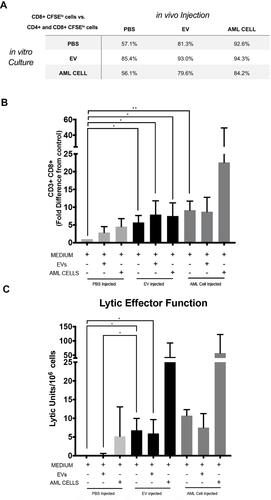
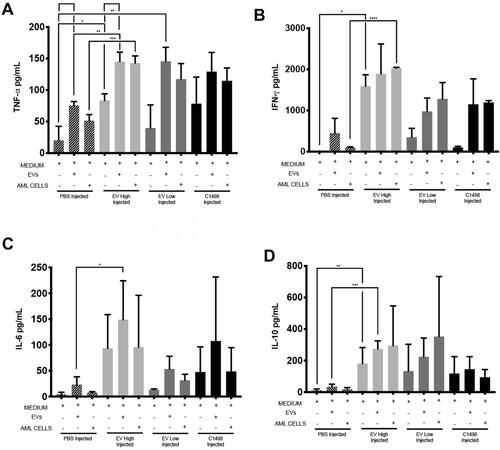
Figure 3 C1498 derived EVs increase cytokine production. Splenocytes obtained from PBS injected, C1498 derived EV immunized, or C1498 cell immunized mice co-cultured in vitro with medium, C1498 derived EVs, or with C1498 cells were incubated for five days at 37°C. Supernatants were then collected and stored at −20°C. These supernatants were tested for cytokine levels using the mouse Th1/Th2/Th17A CBA assay. The cytokines shown are as follows: Panel (A), TNFα; Panel (B), IFNγ; Panel (C) IL6, Panel (D), IL10. Error bars indicate standard deviation of of triplicate samples from a representative of three independent experiments. Asterisks indicate significant differences (*p < 0.05, **p<0.01, ***p<0.001).