Figures & data
Table 1 Target Population Used for This Study (n = 2414)
Table 2 Statistical Analysis for Average Counts of RBC-Related Indices
Figure 1 Accumulative representation of RBC-related blood indices for 2414 patients shown in months from February 2019 until December 2020. (A) Red blood cells (RBC) counts are shown as average for each month ±SEM in 106/µL; (B) Hemoglobin levels are shown as average for each month ±SEM in g/dL; (C) Hematocrit levels are shown as average for each month ±SEM in percentage; (D) Mean corpuscular hemoglobin (MCH) levels are shown as average for each month ±SEM in pg; (E) Mean corpuscular volume (MCV) levels are shown as average for each month ±SEM in fL; (F) RBC distribution width (RDW) levels are shown as average for each month ±SEM in percentage.
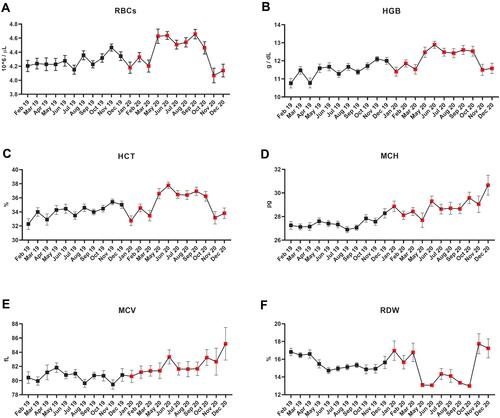
Figure 2 Difference between average means of blood indices. (A) RBCs: red blood cells. (B) HGB: hemoglobin. (C) HCT: hematocrit. (D) MCH: mean corpuscular hemoglobin. (E) MCV: mean corpuscular volume. (F) RDW: RBC distribution width.
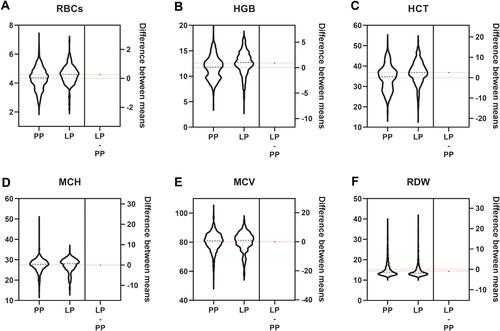
Table 3 Statistical Analysis for Average Counts of WBC-Related Indices
Figure 3 Accumulative representation of WBC-related blood indices for 2414 patients shown in months from February 2019 until December 2020. (A) Total white blood cells (WBC) counts are shown as average for each month ±SEM in 103/µL; (B) Lymphocyte percentages are shown as average for each month ±SEM in percentage; (C) Neutrophil percentages levels are shown as average for each month ±SEM in percentage.
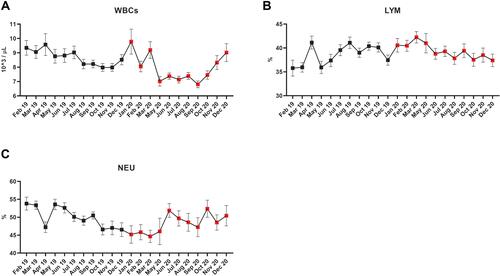
Figure 4 Difference between average means of blood indices. (A) WBCs: white blood cells. (B) LYM: lymphocytes. (C) NEU: neutrophils.
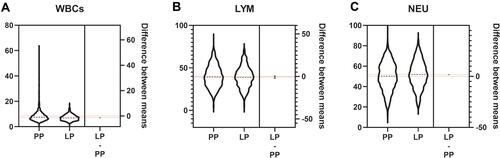
Table 4 Statistical Analysis for Average Counts of Platelet-Related Indices
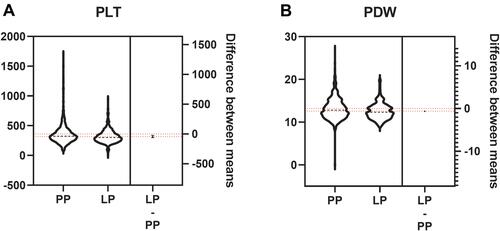
Figure 5 Accumulative representation of platelet-related blood indices for 2414 patients shown in months from February 2019 until December 2020. (A) Platelet counts are shown as average for each month ±SEM in 106/µL; (B) Platelet distribution width (PDW) levels are shown as average for each month ±SEM in percentage.
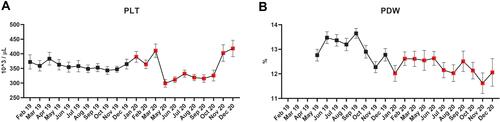
Figure 6 Difference between average means of blood indices. (A) PLT: platelets. (B) PDW: platelet distribution width.