
Figures & data
Table 1 Characteristics of the Studied Population
Table 2 ROC Curve Analysis of All Studied Population to Detect Optimal Cut-off Values, Sensitivity and Specificity of the Hematological Ratios
Figure 1 ROC curve was used to study the optimal cut off values of different hematological ratio; NLR (3.5), d-NLR (2.86), and PLR (192). D-NLR specificity (89.19%) NLR (87%) and PL/LR (77.62%). The sensitivity of NLR (71.38%), d-NLR (67.2%) and the PL/LR (50%).
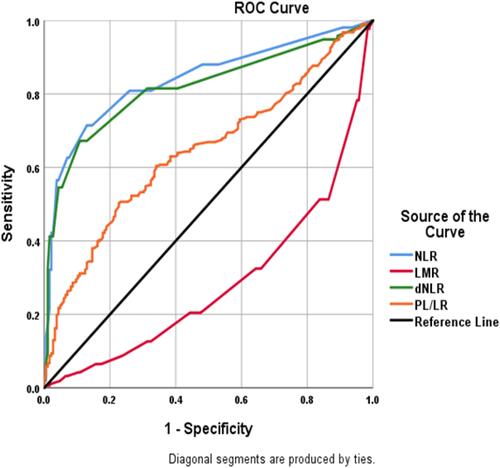
Figure 2 Survival analysis using Kaplan–Meier curve (A) Kaplan–Meier curves showing survival in non-severe, severe and critical group. (B) Kaplan–Meier curve according to NLR (Neutrophil lymphocyte ratio) of COVID-19 patients. (C) Kaplan–Meier curve according to d-NLR (derived neutrophil lymphocyte ratio) of COVID-19 patients. (D) Kaplan–Meier curve according to PLR (platelets lymphocyte ratio) of COVID-19 patients. Numbers below each cure show number at risk.
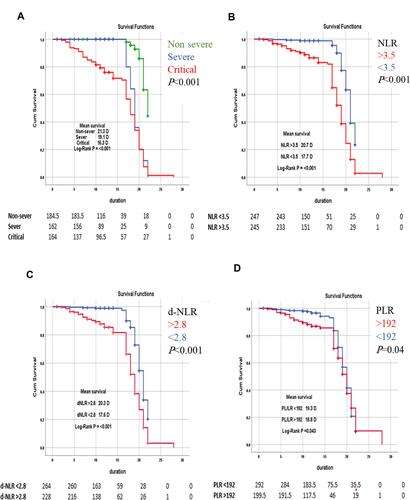
Table 3 Identification of Possible Predictors of Severity in COVID-19 Patients