Figures & data
Table 1 Summary of Relevant Data from 2016 to 2021 (Since the Detection of the Elevated Serum Ferritin)
Table 2 Severity of Iron Overload Based on Hepatic and Myocardial T2*MRI and Our Patient Findings
Figure 1 MRI 1.5 T (Siemens Avanto), using multi-TE gradient echo T2* MRI technique. Heart intensity is normal seen with the longest TE (14.68 msec). T2* =29.4 ms corresponding to <1.2 mg Iron/ g heart dry weight.
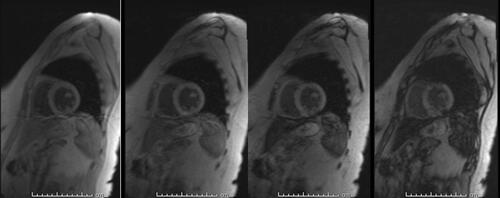
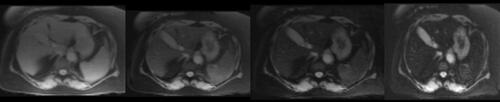
Figure 2 MRI 1.5 T (Siemens Avanto), using multi-TE gradient echo T2* MRI technique (using Garbowski method). Liver intensity is normal seen with the longest TE (14.68 msec). T2* =7.4 ms, corresponding to < 5 mg Iron/ g liver dry weight.