
Figures & data
Figure 1 Effects of Catha edulis Forsk on HgpRBC, NEUT, and NLR in Rats. Each bar represents the mean ± SEM of these indices in rats received AA, T80W, and khat. **Statistical difference at p < 0.01 and *Statistical difference at p < 0.05 when rats received CEF, AA and T80W were compared to each other.
Abbreviations: CEF, Catha edulis Forsk; AA, ascorbic acid; HgpRBC, hemoglobin concentration per red blood cell; NEUT, neutrocyte; NLR, neutrocyte to lymphocyte ratio.
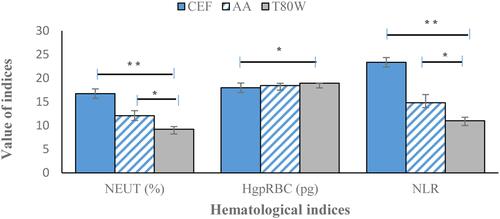
Table 1 Effect of Catha edulis Forsk and Ascorbic Acid on Hematological Indices