Figures & data
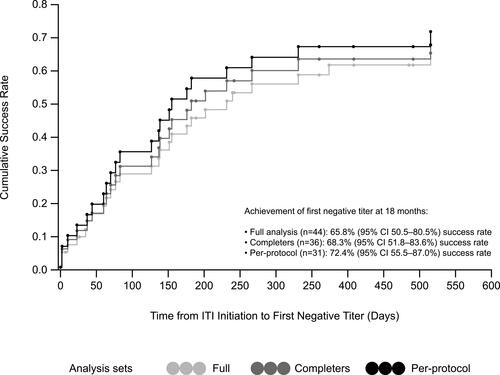
Figure 1 Flow of patients through the PAIR study. *Within 33 months of treatment. †As defined by the protocol.
Abbreviations: CAS, completer analysis set; FAS, full analysis set; ITI, immune tolerance induction; PAIR, Prospective ADVATE Immune Tolerance Induction Registry.
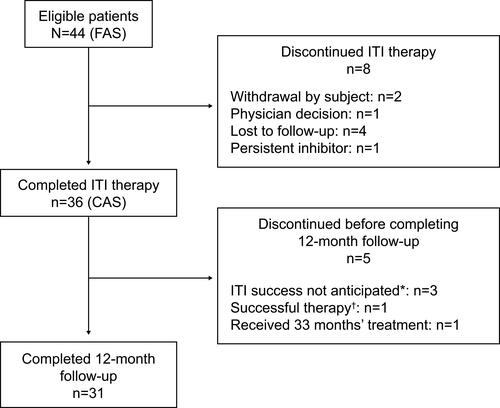
Table 1 Baseline Characteristics of Patients in the PAIR Study
Table 2 ITI Therapy Dosage Regimens Utilized in the PAIR Study
Table 3 Summary of AEs in the PAIR Study (FAS)
Table 4 Outcomes in Patients Who Completed rAHF ITI Therapy (CAS)
Figure 2 Kaplan–Meier success curves for achievement of first negative titer.
Abbreviations: CI, confidence interval; ITI, immune tolerance induction.