
Figures & data
Table 1 Scoring System for Basic TCM Syndrome
Table 2 Scoring System for Stasis Syndrome
Table 3 The Distribution of TCM Syndrome in AA Patients Undergoing HSCT
Figure 1 Evolution of TCM syndromes in severe aplastic anemia (SAA) patients undergoing allogeneic hematopoietic stem cell transplantation (HSCT) based on “Yin–Yang” and “Zang–Fu viscera” syndrome differentiation.
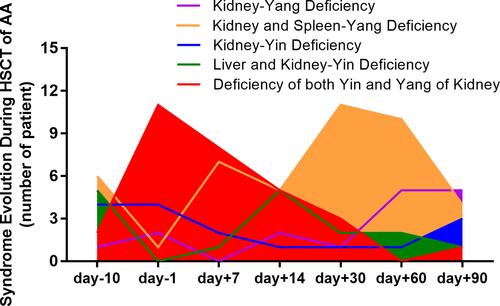
Table 4 Comparison of Stasis Score Among Different Time Point After During HSCT (Wilcoxon), P value
Figure 2 Evolution of “blood stasis” syndrome in SAA patients during HSCT. The stasis syndrome was differentiated, scoring and compared during different stage of HSCT. A total of 61% (11/18) patients were complicated with stasis syndrome before HSCT, and increased after conditioning. After the stem cell engraftment (around +14d), the stasis score decreasing and 88.9% (16/18) had no symptoms of stasis at +90d.
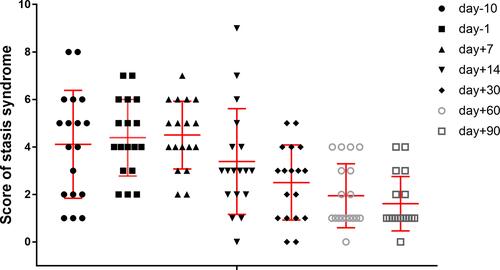
Figure 3 Typical evolution of tongue manifestation during HSCT. Type I: went from the firstly “spleen–kidney Yang deficiency” stage to “liver–kidney Yin deficiency with blood stasis” stage, “spleen–kidney Yang deficiency with blood stasis” stage, and finally of relatively stable “kidney Yang deficiency” stage (2A-2E); Type II: went from “kidney Yang deficiency”, to a syndrome of “Yin deficiency with blood stasis”, to “spleen–kidney Yang deficiency” and finally “kidney Yang deficiency” stage (2F-2J); and Type III: went from “kidney Yin deficiency”, to “Yin deficiency fire hyperactivity”, to “Yin and Yang deficiency”, and finally “kidney Yang deficiency” stage (2K-2O).
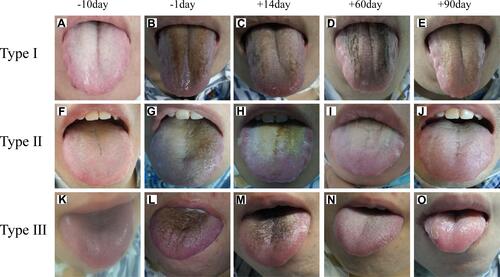
Figure 4 Changes of serum cAMP, cGMP and urine 17-OH-CS during the HSCT process. Data are presented as mean ± SD; *P < 0.01 (as compared with the normal population);+P < 0.05, and ++P < 0.01 (as compared with −10d); #P < 0.01 (as compared with −1d); @P < 0.05, @@P < 0.01 (as compared with +7d); &P < 0.05, and &&P < 0.01 (as compared with +14d).
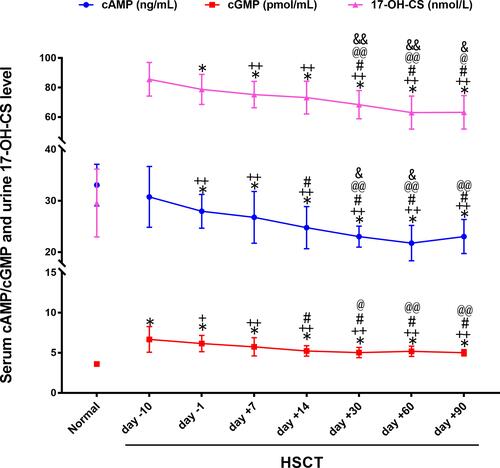
Figure 5 Changes of serum thyroxine during HSCT process. The serum level of total triiodothyronine (TT3), free T3 (FT3) (A) and tetraiodothyronine (TT4), free T4 (FT4) (B) were detected during the HSCT. Data are presented as mean ± SD; *P < 0.01 (as compared with the normal population);+P < 0.05, and ++P < 0.01 (as compared with −10d); #P < 0.05, ##P < 0.01 (as compared with −1d); @P < 0.05, @@P < 0.01 (as compared with +7d); &P < 0.01 (as compared with +14d); ▲P < 0.01 (as compared with +30d).
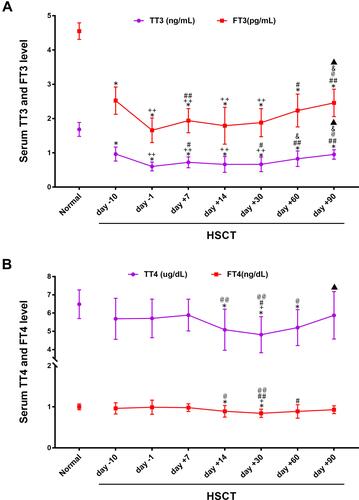
Figure 6 Comparison of iron load and its regulator during HSCT process. The serum level of iron load indexes, ferritin and labile plasma iron (LPI) (A), as well as iron-absorbing regulators, hepcidin and soluble transferrin receptor (sTfR) (B) were detected. Data are presented as mean ± SD; *P < 0.05, **P < 0.01 (as compared with the normal population);+P < 0.05, and ++P < 0.01 (as compared with −10d); #P < 0.05, ##P < 0.01 (as compared with −1d); @P < 0.05, @@P < 0.01 (as compared with +7d); &P < 0.05, and &&P < 0.01 (as compared with +14d).
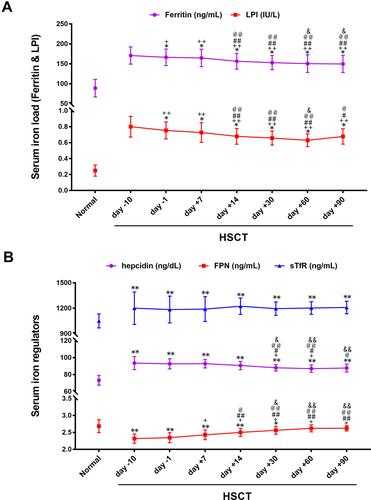
Figure 7 Changes of bone marrow VEGF, NOS, and ROS during HSCT process. The marrow serum level of VEGF, NOS, and ROS were detected. Data are presented as mean ± SD; *P < 0.05, **P < 0.01 (as compared with the normal population); ++P < 0.01 (as compared with −10d); @P < 0.05, and @@P < 0.01 (as compared with +7d).
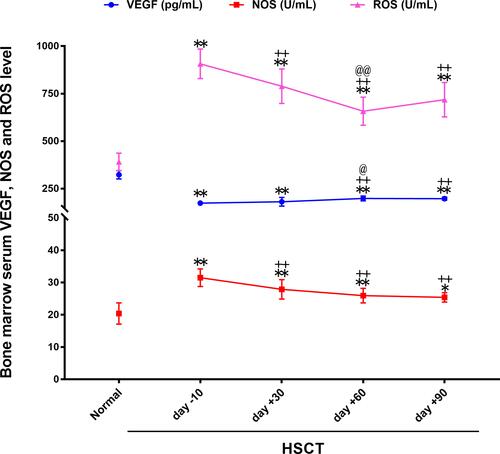
Table 5 Correlation Analysis Between “Yin” and “Yang” Deficiency Syndrome and Serum Indicators (I)
Table 6 Correlation Analysis Between “Yin” and “Yang” Deficiency Syndrome and Serum Indicators (II)
Table 7 Correlation Analysis Between “Blood Stasis” Syndrome and Serum Indicators (I)
Table 8 Correlation Analysis Between “Blood Stasis” Syndrome and Serum Indicators (II)