Figures & data
Table 1 Monoclonal antibodies and their corresponding cell population. In each tube, 25 μL EDTA blood was mixed with 1 μL of the indicated antibodies. In tube 1, representing the isotype controls, the blood sample was mixed with 1 μL of each of anti-moGI-FITC, anti-G2a-PE, and anti-CD14-PerCP. In tube 2, the blood sample was mixed with 1 μL of each of anti-CD11a-FITC, anti-CD11b-PE, and anti-CD14-PerCP. In tube 3, the blood sample was mixed with 1 μL of each of anti-CD18-FITC, anti-CD11c-PE, and anti-CD14-PerCP. In tube 4, the blood sample was mixed only with anti-CD14-PerCP, since this was the negative control
Figure 1 Gating strategy for determining the neutrophil population in a side-scatter/CD14 plot (A), with the neutrophil gate set to exclude monocytes and lymphocytes (A), geometric mean fluorescent intensity (GMFI) values for neutrophil surface markers CD11a (B), CD11b (C), CD11c, (D) and CD18 (E). The gray histograms represent the GMFI of the isotype controls, and the white histogram represents the GMFI of the different surface markers.
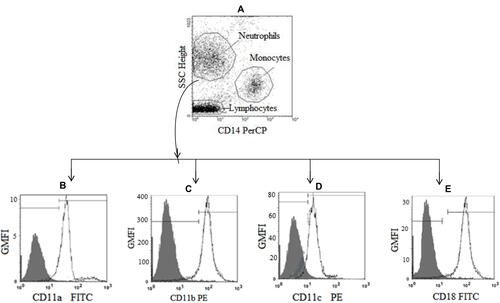
Figure 2 Medians (10th and 90th percentiles) of absolute white blood–cell counts (A) and neutrophil (B) counts in healthy controls and different types of malaria during acute stages of infection (UCM, SMA, CM)* and during convalescence (UCM-F, SMA-F,CM-F)# at 30 days after treatment. p<0.05 considered statistically significant. **p<0.01; ***p<0.0001.
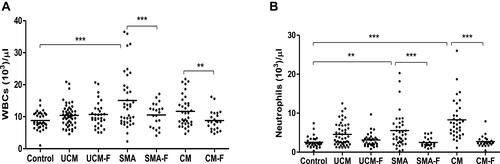
Figure 3 Medians (10th and 90th percentiles) of GMFI of CD11a (A), CD11b (B), CD11c (C), and CD18 (D) on neutrophils during acute stages of different clinical types of malaria (UCM, SMA, and CM)* and in healthy controls. p<0.05 considered statistically significant. **p<0.01; ***p<0.0001.
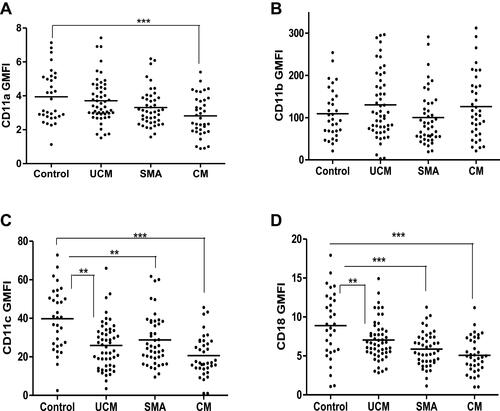
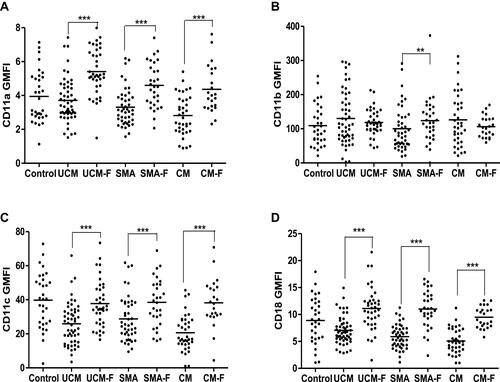
Figure 4 Medians (10th and 90th percentiles) of GMFI of CD11a (A), CD11b (B), CD11c (C), and CD18 (D) on neutrophils in healthy controls and in acute stages of infection (UCM, SMA, and CM)* and during convalescence (UCM-F, SMA-F and CM-F)# when at 30 days after treatment. p<0.05 considered statistically significant. **p<0.01; ***p<0.0001.