
Figures & data
Table 1 Demographic Characteristics of ITP Patients
Figure 1 Distribution of age and gender of ITP patients.
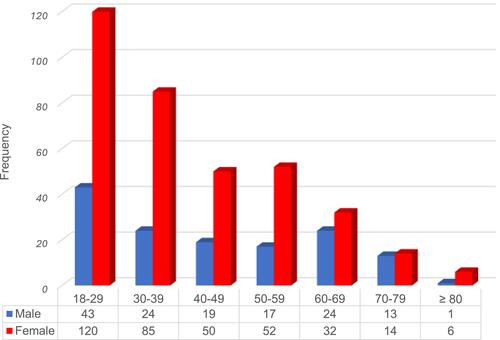
Figure 2 Bleeding symptoms at presentation by anatomical site.
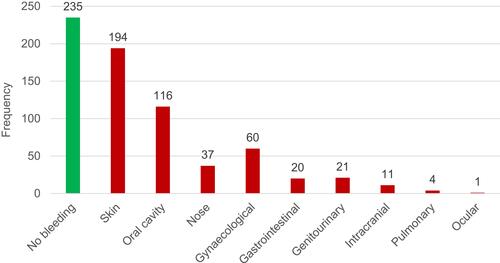
Figure 3 Platelet count at the time of ITP diagnosis. The vertical line indicates a platelet count of 20 × 109/L.
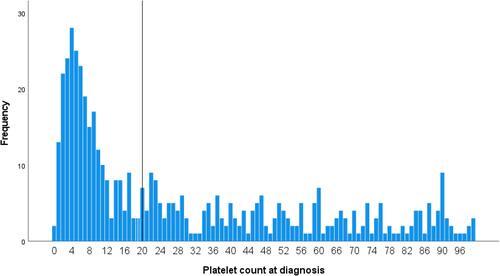
Table 2 Laboratory Test Results
Table 3 Treatment Exposure at Diagnosis
Table 4 Mortality Risk of ITP Patients
Table 5 Incidence of Adult ITP Patients in General Population