Figures & data
Figure 1 Bone Marrow Biopsy Case #1. The initial bone marrow biopsy of case #1 revealed infiltrating large, atypical lymphocytes with open chromatin and prominent nucleoli (A, H&E stain x 40) which were positive for CD20 (B, IHC x 40). The black arrows in A and B indicate frequent mitosis. Three years later, repeat bone marrow biopsy with roll prep-smear demonstrated recurrent lymphoma (C, WG stain x 50; D, H&E x 40). The neoplastic lymphocytes were positive for PAX5 (E, IHC x 20) and showed a high proliferative rate with a Ki-67 of 60% (E and F, IHC x 40).
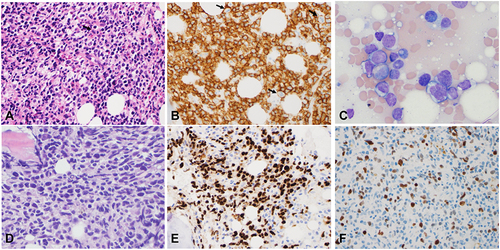
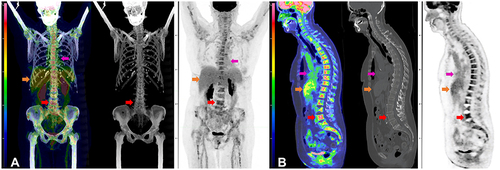
Figure 2 Initial FDG PET-CT and Post-Treatment FDG PET-CT for Case #1. Composite FDG PET-CT images of case #1 at initial diagnosis (A and B) and after R-CHOP and high-dose MTX (C and D). Coronal view of fused FDG PET-CT MIP, CT, and PET (A) and sagittal fused FDG PET-CT, CT, and PET (B) demonstrates intense FDG accumulation in the bone marrow of the axial and appendicular skeleton at initial diagnosis without a specific focus of FDG accumulation, nor lytic or sclerotic lesions on CT. Reference L3 vertebral body SUVmax of 9.9 (red arrow). Physiologic FDG accumulation is seen in the liver (Orange arrow) and blood pool (magenta arrow) and spleen. No hypermetabolic lymph nodes or other soft tissue to suggest lymphomatous involvement. Post treatment fused FDG PET-CT MIP, CT, and PET (C) and sagittal fused FDG PET-CT, CT, and PET (D) demonstrate normalization of FDG accumulation in the bone marrow of the axial and appendicular skeleton (red arrow) with the L3 vertebrae (SUVmax of 2.3), and unchanged FDG accumulation in the liver (Orange arrow) and blood pool (magenta arrow).
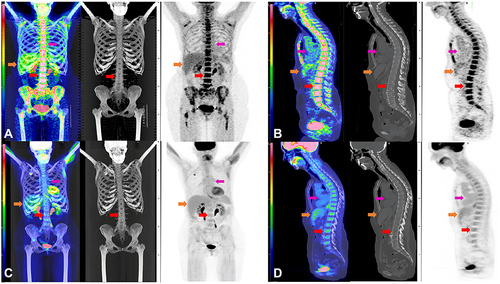
Figure 3 Peripheral Smear and Bone Marrow Biopsy Case #2. For case #2, circulating atypical large lymphocytes (arrows) were present in the peripheral blood smear (A, WG stain, x 40; inset x 60). The roll prep smear and bone marrow biopsy revealed diffusely infiltrating lymphoma cells (B, WG stain x 40; C, H&E stain x 20). IHC showed the lymphoma cells were positive for CD79a and CD10 with a high proliferative rate by Ki-67 (80%) (D, E, F, x 20).
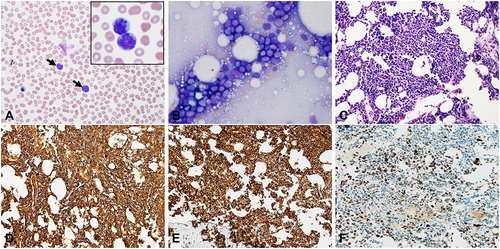
Figure 4 Peripheral Blood Flow Cytometry and FISH Testing for Case #2. For case #2, ancillary studies were performed on the peripheral blood as the bone marrow was a dry tap. Flow cytometry analysis identified two distinct B-cell populations (A–E). One B-cell population (red color) expressed CD19, CD5, and CD23 but was negative for CD10. The second B-cell population (pink color) was positive for CD10 but negative for CD5 and CD23. Both populations showed kappa light chain restriction (C and D). FISH break-apart probes showed MYC gene rearrangement and BCL2 gene rearrangement (F and G, green and red arrows indicate break apart signals) and identified deletion of 13q14.3 (H).
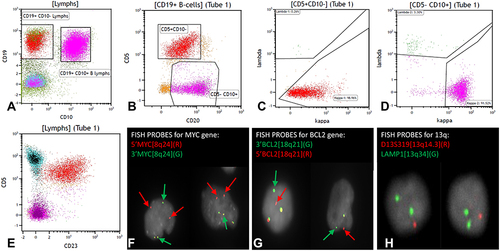
Figure 5 FDG PET-CT of Case #2 After Cycle 1 of R-CHOP. Composite FDG PET-CT images of case #2 after cycle 1 of R-CHOP chemotherapy. Coronal view of fused FDG PET-CT MIP, CT, and PET (A) and sagittal fused FDG PET-CT, CT, and PET (B) demonstrates moderate intense FDG accumulation in the bone marrow of the axial and appendicular skeleton without a specific focus of FDG accumulation nor lytic or sclerotic lesions on CT. Reference L4 vertebral body SUVmax of 5.9 (red arrow). Physiologic FDG accumulation is seen in the liver (Orange arrow) and blood pool (magenta arrow) and spleen. No hypermetabolic lymph nodes or other soft tissue to suggest lymphomatous involvement.