
Figures & data
Table 1 Demographic and Clinical Characteristics of the Participants (N=1369)
Table 2 Distribution of D Antigens by Blood Group (N=1369)
Table 3 Distribution of IAT-Positive Results by Rh Blood Group (N=1369)
Table 4 Rh Antigen and IAT Distribution (N=1369)
Figure 1 Percentage distribution of Rh alloimmunization among the Rh D+ pregnant women.
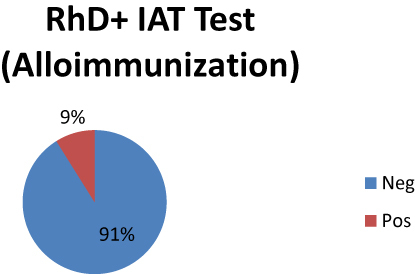
Table 5 Distribution of IAT-Positive Results by ABO Blood Group (N=1369)