
Figures & data
Table 1 General Characteristics and Laboratory Data of the Patients in This Study
Table 2 Mean Age Distribution
Table 3 Gender Distribution
Table 4 Age Groups Distribution
Table 5 Distribution of Ferritin Levels Among BTM Patients
Table 6 Body Mass Index Distribution
Figure 1 Frequency distribution of body mass index.
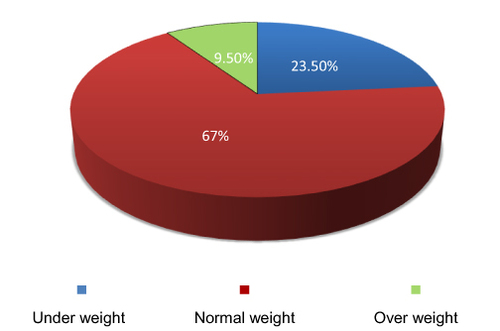
Figure 2 Distribution of Diabetes mellitus among the patients according to age groups.
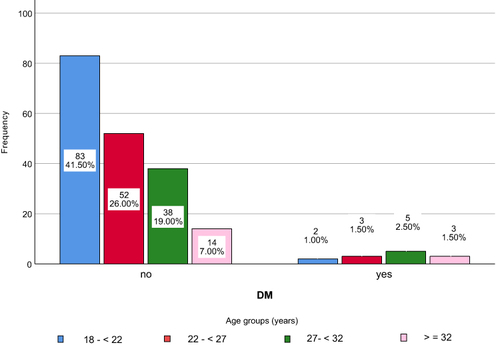
Figure 3 Distribution of Diabetes mellitus among the patients with different ferritin levels.
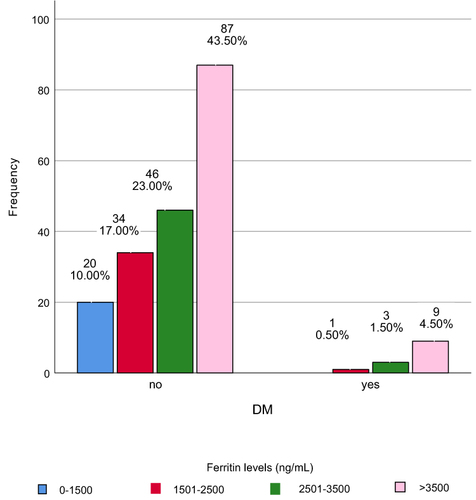
Figure 4 Distribution of Diabetes mellitus among the patients with different classes of BMI.
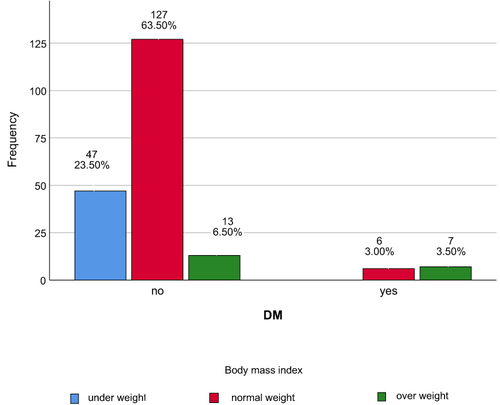
Table 7 Study of DM Among Lean Groups of Adult BTM Patients
Figure 5 Distribution of Diabetes mellitus among the patients according to gender.
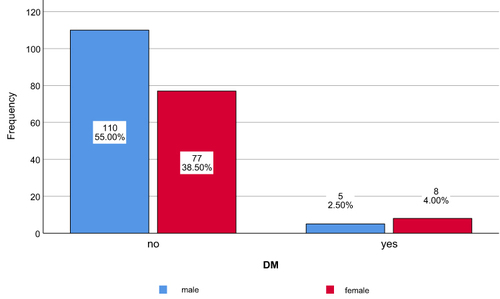
Table 8 Association Between DM and Various Parameters
Table 9 Correlation Between Serum Ferritin and Hepatic and Cardiac MRI T2*
Figure 6 Correlation between liver MRI T2* and ferritin.
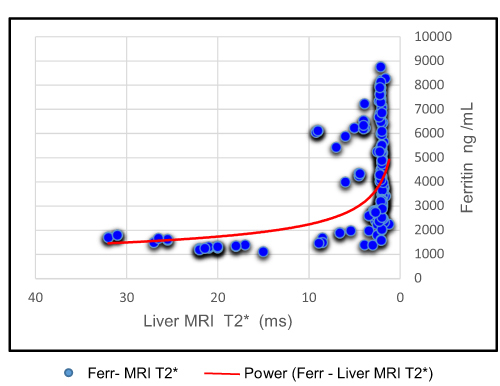
Figure 7 Correlation between cardiac MRI T2* and ferritin.
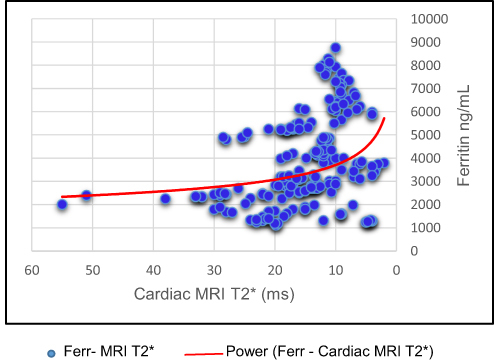
Table 10 Bivariate Correlations Analysis of Liver and Cardiac MRI T2*
Table 11 Comparative Study of Our Work with Previous Studies