
Figures & data
Figure 1 MRI Imaging at Second Relapse. Contrast enhanced axial MRI showing infiltrative, multifocal, enhancing mass lesions with one of the larger components centered within the splenium of the corpus callosum.
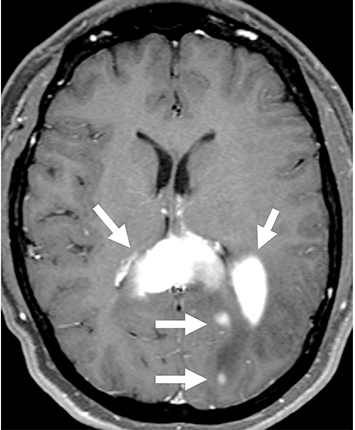
Figure 2 Pathologic Evaluation of the Left Parietal Tumor. H&E x40 magnification shows large B cells (A). IHC x20 magnification shows that the neoplastic B-cells stained positive for CD20 (B), BCL6 (C), BCL2 (D), MUM1 (E) with a high MIB1 proliferation rate (F).
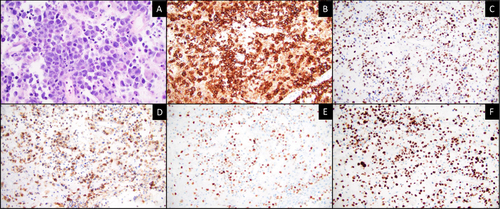
Figure 3 MRI Imaging Post-Treatment. (A and B) MRI after salvage therapy with near complete remission. (C) Repeat contrast enhanced MRI following day 100 work-up status post second ASCT shows complete remission.
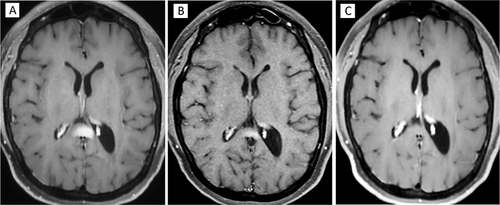
Table 1 Case Presentation Treatment Summary
Table 2 Summary of Clinical Trials in SCNSL and Reported Outcomes