
Figures & data
Figure 1 Flow chart of analysis of patient samples.
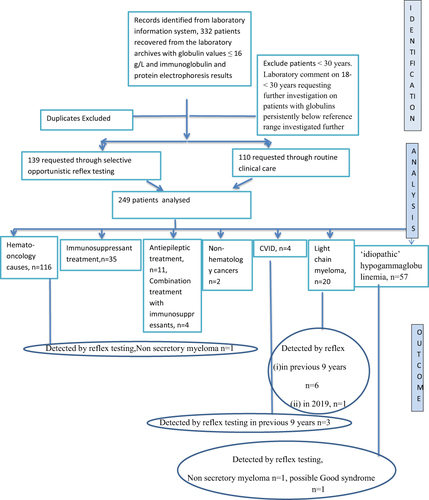
Table 1 Diagnosis of Patients with Globulin Levels ≤ 16 g/L
Figure 2 IgG levels at different globulin concentrations. The lower reference range of IgG = 7 g/L is indicated by the horizontal line in the figure. IgG <3 g/L has been converted to 3 g/L in the graph.
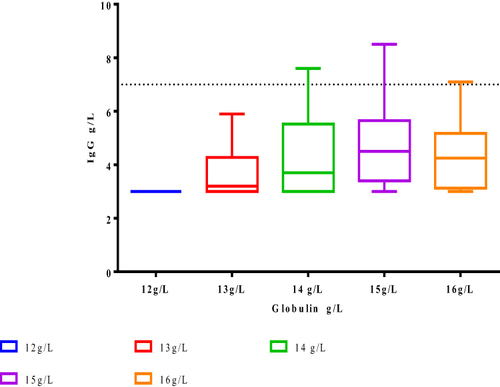
Figure 3 Diagnosis of patients with globulin levels ≤ 16 g/L.
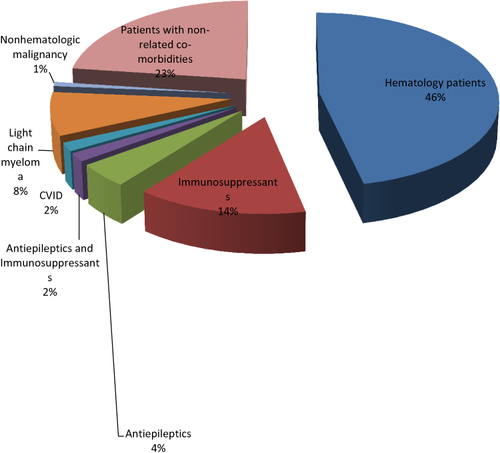
Figure 4 Hematology subgroups.
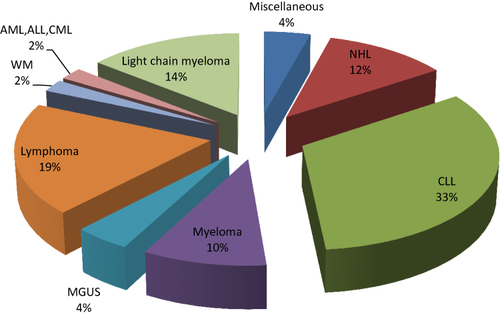
Figure 5 Follow-up details on patients with globulin ≤ 16 g/L, idiopathic hypogammaglobulinemia.
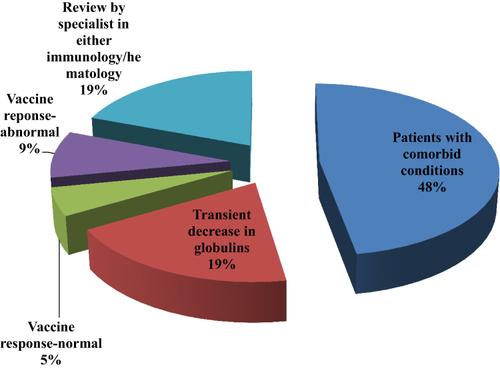
Table 2 Summary of Diagnostic Outcomes