
Figures & data
Figure 1 Box-and-whisker graphs of blood parameters obtained by MedCalc statistical software. (A) is belong to female hemoglobin, most of the data is between 11.9 to 16, (B) is belong to male Hb, the data is normally distributed therefore the length of whiskers are similar and from graph it is clearly can be observed that the reference interval is between 13.7-17.7, (C) is belong to the female RBCs the data is normally distributed and the reference range clearly observed from the middle point of whiskers. (D) is representing the RBCs of male candidates, the majority of data is situated between 4.9 to 6.5. (E) is belonging to the female HCT, most of the data is situated between 34 to 47 and the data is not distributed normally. (F) is representative of male HCT the data is not distributed normally and most of the data is situated between 38 to 52. (G) is belong to the female RDW, the data is not distributed normally, (H) is representative of male RDW, the data is not distributed normally. (I) represents female MCV, data is not distributed normally, (J) represents MCV for male population, (K) represents MCH for female population, (L) represents MCH for male population, (M) represents MCHC for female population, (N) represents MCHC for female population.
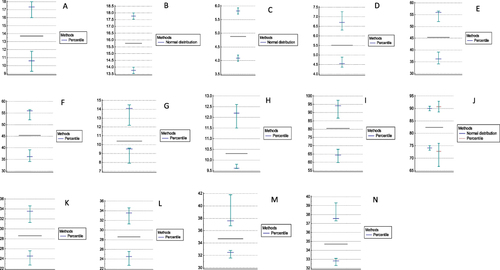
Table 1 Statistical Analysis of Blood Parameters for the Determination of Reference Intervals
Table 2 Lower Limit and Upper Limit of Reference Intervals of Blood Parameters, with 90% Confidence Intervals
Table 3 Statistical Analysis of Blood Indices for the Determination of Reference Intervals
Table 4 Lower Limit and Upper Limit of Reference Intervals of Blood Indices, with 90% Confidence Intervals