Figures & data
Figure 1 Flow chart of subject selection.
Abbreviations: ALL, acute lymphoblastic leukemia; ALL-L3, acute lymphoblastic leukemia with bone marrow morphology showed L3.
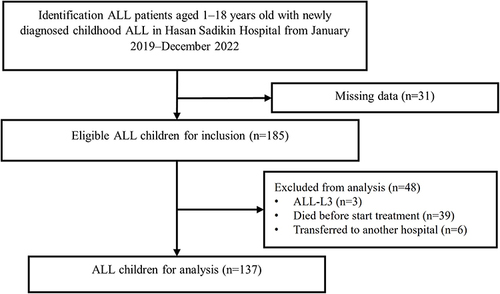
Table 1 Demographical and Clinical Characteristics of Subjects
Table 2 Association Between Demographical and Clinical Characteristics to the Outcome and Hazard Ratio to Overall Survival (OS)
Table 3 Multivariate Cox Regression Analysis
Figure 2 Kaplan–Meier curves of probable cumulative OS and EFS.
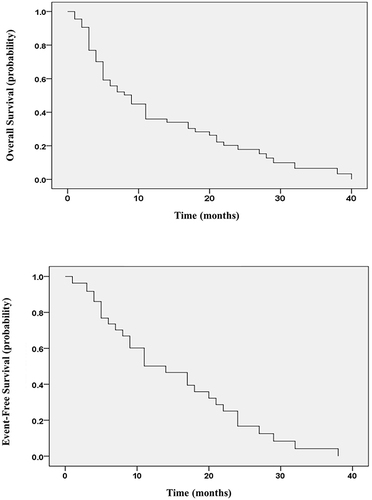
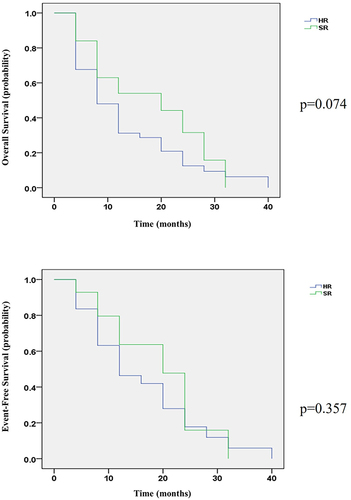
Figure 3 Kaplan–Meier curves of probable OS and EFS SR and HR risk stratification group.
Abbreviations: SR, standard risk; HR, high risk.