
Figures & data
Figure 1 Schematic structure of the fibrinogen molecule.
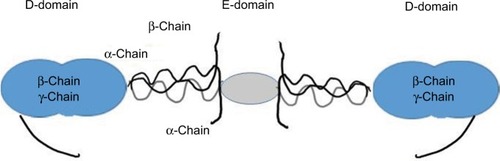
Table 1 Causes of hypofibrinogenemia and dysfibrinogenemia
Figure 2 A schematic representation of the formation of a fibrin clot including time to initiate coagulation, rate of formation of fibrin, formation of the stable clot, and strength of the clot once formed. Individual parameters available for the assessment of fibrinogen status are annotated.
Abbreviations: MCF, maximum clot firmness; MA, maximum amplitude; PT, prothrombin time; MAXV-t, time to maximum velocity; Fgn, fibrinogen; R time, CT, time to clot.
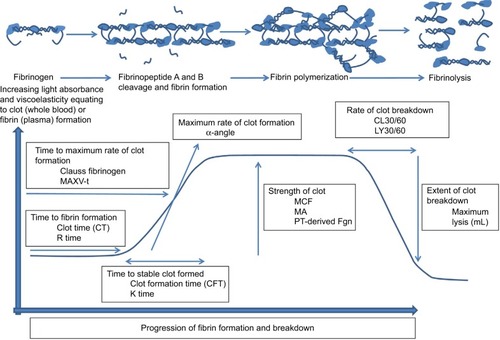
Figure 3 Determination of fibrinogen level (latex agglutination) during cardiopulmonary bypass in a patient anticoagulated with high-dose direct thrombin inhibitor (DTI – Bivalirudin).
Abbreviations: PT, prothrombin time; aPTT, activated partial thromboplastin time; Pre-op, preoperative; CPB, cardiopulmonary bypass; Fgn, fibrinogen; TT, thrombin time.
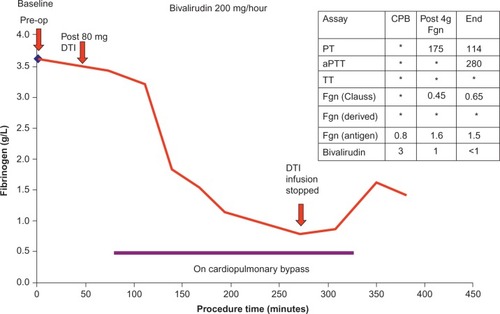
Figure 4 Schematic representation of a ROTEM/TEG FIBTEM/functional fibrinogen plot with parameters and the effect of drugs and deficiencies on the various phases and parameters of the assay.
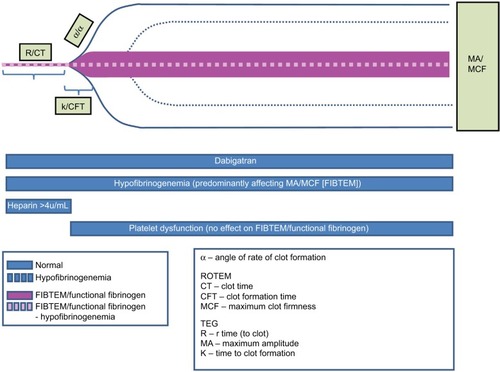
Table 2 Impact of hypofibrinogenemia on important laboratory assays