Figures & data
Table 1 Levels of HMGB1 and PAI-1 before and after aHSCT
Figure 1 The comparison of HMGB1 levels.
Note: Data are shown as means ± SD.
Abbreviations: TBI, total body irradiation; CY, cyclophosphamide; Flu, fludarabine; Bu, busulfan; BMT, bone marrow transplantation; PBSCT, peripheral blood stem cell transplantation; CBT, cord blood transplantation; Cys, cyclosporine; FK, tacrolimus; NS, not significant; HMGB1, high-mobility group box 1; SD, standard deviation.
Abbreviations: TBI, total body irradiation; CY, cyclophosphamide; Flu, fludarabine; Bu, busulfan; BMT, bone marrow transplantation; PBSCT, peripheral blood stem cell transplantation; CBT, cord blood transplantation; Cys, cyclosporine; FK, tacrolimus; NS, not significant; HMGB1, high-mobility group box 1; SD, standard deviation.
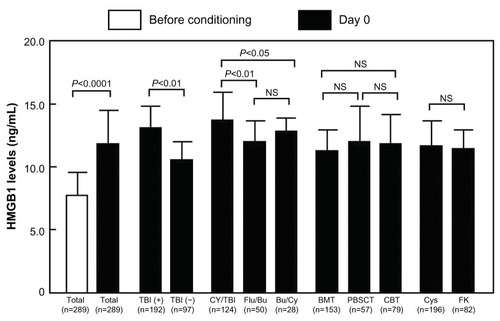
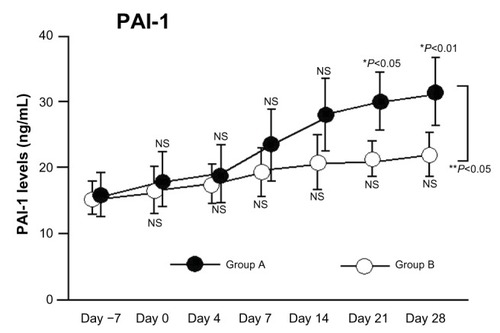
Figure 2 Changes in PAI-1 levels following aHSCT conditioning regimens with and without significant elevation in HMGB1.
Notes: Group A: HMGB1 levels >1.5-fold higher than baseline. Group B: HMGB1 levels <1.5-fold higher than baseline. *P-values are for comparison with each baseline parameter (before vs day 0, 4, 7, 14, 21, or 28); **Group A vs Group B.
Abbreviations: PAI-1, plasminogen activator inhibitor-1; aHSCT, allogeneic hematopoietic stem cell transplantation; HMGB1, high-mobility group box 1; NS, not significant.
Abbreviations: PAI-1, plasminogen activator inhibitor-1; aHSCT, allogeneic hematopoietic stem cell transplantation; HMGB1, high-mobility group box 1; NS, not significant.