
Figures & data
Figure 1 Distribution of cases based on whether or not they satisfied the criteria.
Abbreviation: ACR, American College of Rheumatology.
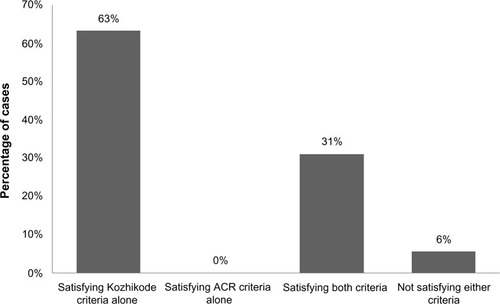
Table 1 Average time required to satisfy the ACR criteria among the cases
Figure 2 Clinical manifestations in patients with SLE.
Abbreviations: SLE, systemic lupus erythematosus; PUO, pyrexia of unknown origin.
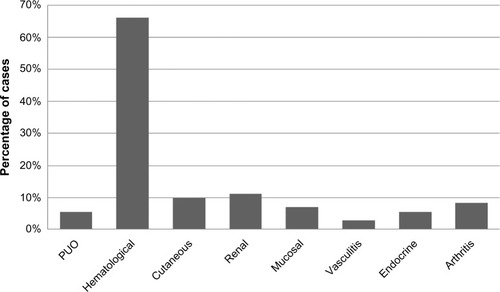
Figure 3 Level of physical activity in the patients with SLE.
Abbreviation: SLE, systemic lupus erythematosus.
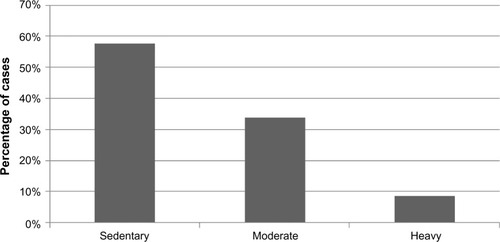
Table 2 Comparison of ACR criteria and Kozhikode criteria