Figures & data
Table 1 Primer list for RT-PCR
Figure 1 Time course of physiological profiles during liver regeneration after 70% PH in rats.
Abbreviations: ALT, alanine aminotransferase; PH, partial hepatectomy; SD, standard deviation.
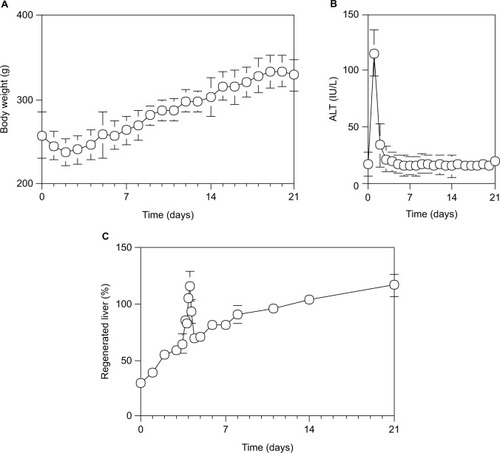
Figure 2 Time course of physiological effects of drugs in rats during liver regeneration after 70% PH.
Abbreviations: ALT, alanine aminotransferase; EB, Evans blue; PH, partial hepatectomy; SAM, salicylamide; SD, standard deviation; Vdss, distribution of volume at a steady state after drug administration.
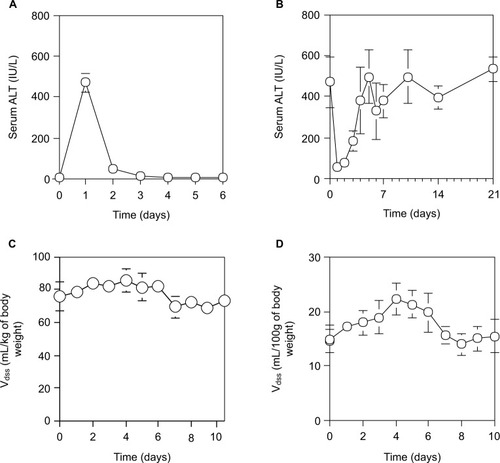
Table 2 Pharmacokinetic parameters of SAM in rats after intravenous administration of SAM 68.5 mg/kg of body weight
Figure 3 [Ca2+]i in hepatocytes during liver regeneration after 70% PH.
Abbreviations: AM, acetoxymethyl ester; PBS, phosphate-buffered saline; PH, partial hepatectomy; SD, standard deviation; HBSS, Hanks’ balanced salt solution.
![Figure 3 [Ca2+]i in hepatocytes during liver regeneration after 70% PH.](/cms/asset/699bc2ba-1971-4fd7-8177-3ce9f58dde4e/djep_a_106084_f0003_b.jpg)
Figure 4 Cell cycle distribution during liver regeneration after 70% PH.
Abbreviations: PH, partial hepatectomy; PI, propidium iodide; SD, standard deviation.
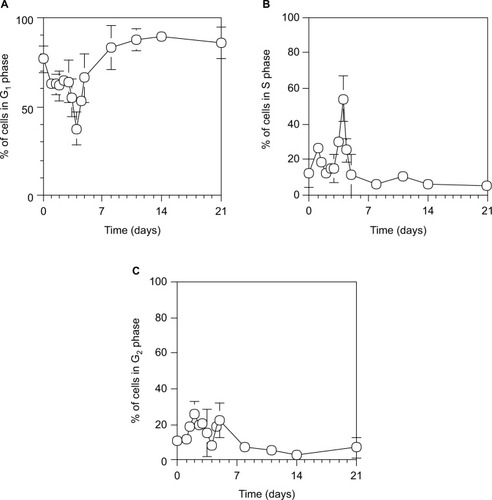
Figure 5 Protein contents (A) and cytochrome P450 level (B) in microsomes per 1 g of wet liver in rats during liver regeneration after 70% PH.
Abbreviations: PH, partial hepatectomy; SD, standard deviation.
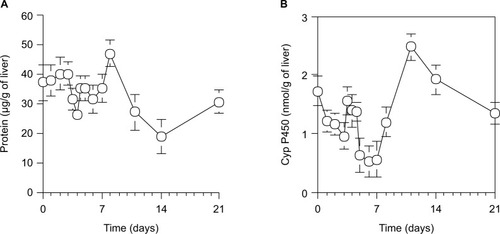
Figure 6 RNA content (A) and expression levels of VEGF and β-actin (B) in the liver.
Abbreviation: SD, standard deviation.
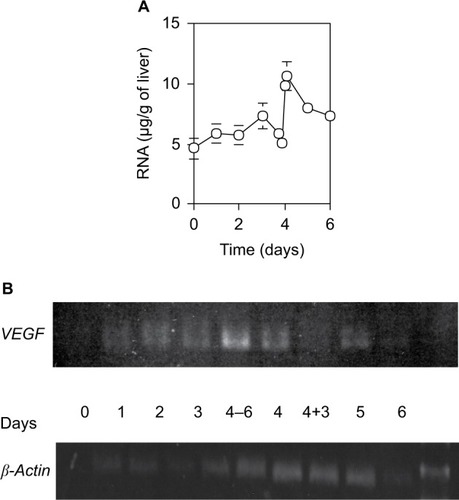
Figure 7 Expression levels per total RNA unit content of several genes after 70% PH.
Abbreviations: PH, partial hepatectomy; SD, standard deviation.
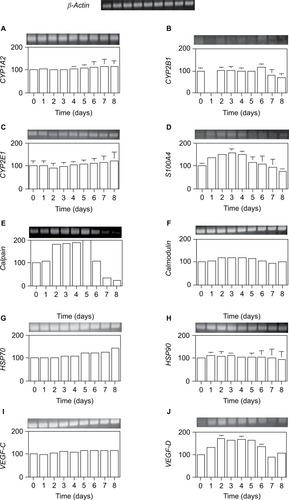
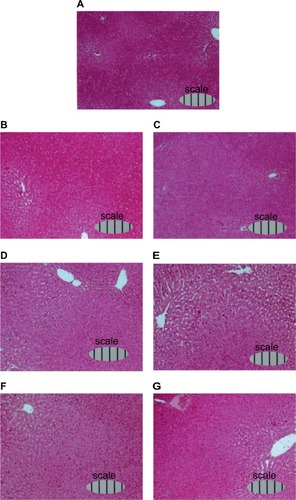
Figure 8 Light microphotographs of H&E-stained liver sections of rats during liver regeneration after 70% PH (×10).
Abbreviations: H&E, hematoxylin and eosin; PH, partial hepatectomy.