
Figures & data
Table 1 Mean percent blood glucose reduction of gliclazide in presence and absence of curcumin in normal rats (n=6)
Table 2 Mean percent blood glucose reduction of gliclazide in presence and absence of curcumin in diabetic rats (n=6)
Table 3 Mean percent blood glucose reduction of gliclazide in presence and absence of curcumin in rabbits (n=6)
Table 4 Effect of curcumin on glucose insulin homeostasis of gliclazide in normal rats (n=6)
Table 5 Effect of curcumin on glucose insulin homeostasis of gliclazide in diabetic rats (n=6)
Table 6 Effect of curcumin on glucose insulin homeostasis of gliclazide in rabbits (n=6)
Figure 1 Mean gliclazide concentration in serum (ng/mL) before and after treatment with curcumin in rabbits (n=6).
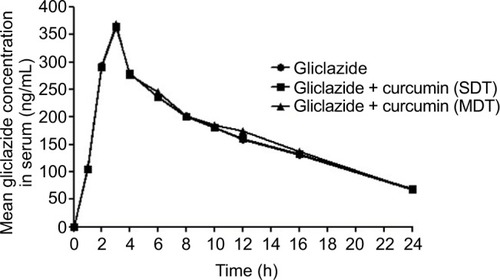
Table 7 Mean pharmacokinetic parameters of gliclazide before and after administration of curcumin in rabbits (n=6)